jacoblund/iStock via Getty Images
Investment Thesis
Have you ever imagined having a diversified dividend portfolio that not only offers an elevated likelihood of favorable investment results due to its reduced risk level, but also the potential to enhance your lifestyle? For example, allowing you to attend your favorite team’s next baseball, basketball, or football game with your best friends is funded by dividend payments.
In a recent article, I listed 10 high dividend yield companies that I consider to be worth investing in during the month of March 2024. This was particularly based on their presently attractive Valuation, financial health and competitive advantages.
The article documents a dividend portfolio that has been designed to merge dividend income with dividend growth potential, crafted to optimize returns while minimizing risks. The portfolio consists of three ETFs, March’s top 10 high dividend yield companies and five carefully selected picks that can contribute to increasing its dividend growth potential.
Moreover, this article includes a comprehensive risk analysis in which I will discuss the portfolio’s reduced risk level. This is demonstrated by its strategic diversification, where no company accounts for more than 5% of the overall portfolio and no sector exceeds 20%.
The five largest individual positions of this dividend portfolio exhibit attractive risk-reward profiles, further highlighting the reduced risk level.
Their attractive risk-reward profile is underlined by high EBITDA-Margins (each of the five largest individual positions has an EBITDA-Margin above 20%) and their proven track record of dividend growth (one of the selected individual positions has shown 61 consecutive years of dividend growth).
The diminished risk profile of this dividend portfolio is further evidenced by the robust creditworthiness of its five core holdings: the five largest individual positions boast a minimum Moody’s credit rating of Baa1, with two of them achieving the highest Aaa credit rating, indicating that this portfolio puts capital preservation above all.
It is further worth highlighting that the Combined Weighted Average Yield (which encompasses both the Average Dividend Yield of the stocks and the Average Yield of the bonds) of this portfolio stands at 3.58%, indicating that it is adequate for investors aiming to generate extra income via dividend payments from stocks and interest from bonds.
I have included the following 10 high-dividend-yield companies as part of this dividend portfolio:
- Coca-Cola (NYSE:KO)
- Enterprise Products Partners (NYSE:EPD)
- Verizon (NYSE:VZ)
- Altria Group (NYSE:MO)
- Realty Income (NYSE:O)
- CVS Health (NYSE:CVS)
- Bayerische Motoren Werke (OTCPK:BMWYY) (OTCPK:BAMXF)
- MPLX LP (NYSE:MPLX)
- BB Seguridade Participações S.A. (OTCPK:BBSEY)
- The Bank of Nova Scotia (NYSE:BNS)
In addition, I have selected the following five companies that will elevate the portfolio’s potential for dividend growth:
- Nike (NYSE:NKE)
- American Express (NYSE:AXP)
- Visa (NYSE:V)
- Microsoft (NASDAQ:MSFT)
- Apple (NASDAQ:AAPL)
Furthermore, I have included the following ETFs:
- Schwab U.S. Dividend Equity ETF (NYSEARCA:SCHD)
- iShares Core High Dividend ETF (HDV)
- Schwab Short-Term U.S. Treasury ETF (NYSEARCA:SCHO)
Overview of the 3 Selected ETFs, February’s Top 10 High Dividend Yield Stocks, and the 5 additional Dividend Growth Companies
|
Symbol |
Name |
Sector |
Industry |
Country |
Market Cap |
Dividend Yield [TTM] |
Payout Ratio |
Dividend Growth 5 Yr [CAGR] |
P/E [FWD] |
Allocation |
Amount |
|
SCHD |
Schwab U.S. Dividend Equity ETF |
ETF |
ETF |
United States |
3.48% |
13.05% |
30.00% |
30000 |
|||
|
HDV |
iShares Core High Dividend ETF |
ETF |
ETF |
United States |
3.64% |
4.70% |
20.00% |
20000 |
|||
|
KO |
The Coca-Cola Company |
Consumer Staples |
Soft Drinks & Non-alcoholic Beverages |
United States |
256.68B |
3.09% |
68.40% |
3.36% |
21.71 |
2.00% |
2000 |
|
EPD |
Enterprise Products Partners L.P. |
Energy |
Oil and Gas Storage and Transportation |
United States |
60.71B |
7.16% |
79.02% |
3.05% |
10.52 |
2.00% |
2000 |
|
VZ |
Verizon Communications Inc. |
Communication Services |
Integrated Telecommunication Services |
United States |
166.11B |
6.67% |
55.94% |
2.01% |
8.71 |
1.50% |
1500 |
|
MO |
Altria Group, Inc. |
Consumer Staples |
Tobacco |
United States |
73.84B |
9.17% |
77.58% |
5.06% |
8.35 |
2.00% |
2000 |
|
O |
Realty Income Corporation |
Real Estate |
Retail REITs |
United States |
45.66B |
5.80% |
74.43% |
3.63% |
37.03 |
4.00% |
4000 |
|
CVS |
CVS Health Corporation |
Health Care |
Health Care Services |
United States |
94.47B |
3.30% |
27.69% |
4.40% |
10.93 |
2.50% |
2500 |
|
BMWYY |
Bayerische Motoren Werke Aktiengesellschaft |
Consumer Discretionary |
Automobile Manufacturers |
Germany |
71.61B |
7.90% |
– |
14.42% |
9.14 |
1.50% |
1500 |
|
MPLX |
MPLX LP |
Energy |
Oil and Gas Storage and Transportation |
United States |
40.85B |
8.04% |
86.78% |
5.14% |
9.99 |
2.00% |
2000 |
|
BBSEY |
BB Seguridade Participações S.A. |
Financials |
Multi-line Insurance |
Brazil |
13.01B |
8.75% |
73.00% |
-4.71% |
8 |
2.00% |
2000 |
|
BNS |
The Bank of Nova Scotia |
Financials |
Diversified Banks |
Canada |
61.26B |
6.26% |
66.59% |
4.28% |
10.5 |
2.50% |
2500 |
|
NKE |
NIKE, Inc. |
Consumer Discretionary |
Footwear |
United States |
150.24B |
1.43% |
40.64% |
11.07% |
27.7 |
3.00% |
3000 |
|
AXP |
American Express Company |
Financials |
Consumer Finance |
United States |
161.69B |
1.07% |
21.41% |
10.15% |
17.55 |
3.00% |
3000 |
|
V |
Visa Inc. |
Financials |
Transaction & Payment Processing Services |
United States |
562.59B |
0.69% |
21.58% |
16.09% |
28.62 |
3.00% |
3000 |
|
MSFT |
Microsoft Corporation |
Information Technology |
Systems Software |
United States |
3.02T |
0.70% |
25.86% |
10.20% |
34.84 |
4.00% |
4000 |
|
AAPL |
Apple Inc. |
Information Technology |
Technology Hardware, Storage and Peripherals |
United States |
2.64T |
0.56% |
14.80% |
5.63% |
26.08 |
5.00% |
5000 |
|
SCHO |
Schwab Short-Term U.S. Treasury ETF |
Taxable Bond |
Short Government Bond |
United States |
4.02% |
15.04% |
10% |
10000 |
Source: The Author, data from Seeking Alpha
Risk Analysis of The Current Composition of This Dividend Portfolio
Risk Analysis of the Asset Allocation
While 84% of this investment portfolio is invested in U.S. Equities, 6% has been allocated to Non-U.S. Equities.
Meanwhile, I have allocated 10% of this investment portfolio to fixed income assets, which helps us to significantly decrease its volatility.
10% of this portfolio has been allocated to Schwab Short-Term U.S. Treasury ETF. This U.S. Treasury ETF provides investors with a Standard Deviation of 2.24, which is significantly below the Median of all ETFs (14.66).
Source: The Author, data from Morningstar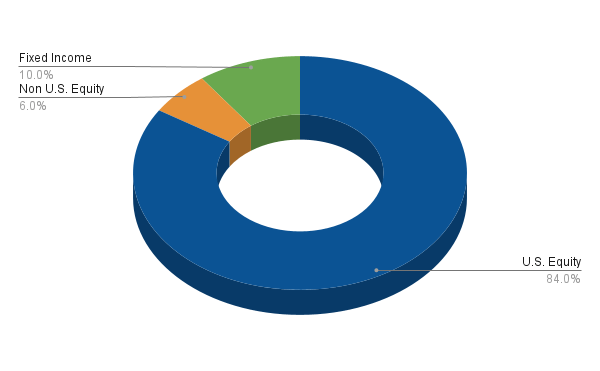
This asset allocation underscores the portfolio’s attractive risk-reward profile, overweighting U.S. Equities with attractive risk-reward profiles (as I will demonstrate in the following) while underweighting fixed income assets, which contributes to reducing portfolio volatility.
Risk Analysis of the Portfolio Allocation per Company/ETF
With a share of 30%, Schwab U.S. Dividend Equity ETF represents the largest proportion of this portfolio, followed by iShares Core High Dividend ETF (20%), and Schwab Short-Term U.S. Treasury ETF (10%).
The strategical distribution of 60% to these ETFs is an additional indicator of the reduced risk level that this investment portfolio carries.
I have selected Schwab U.S. Dividend Equity ETF as the largest position, given the ETF’s effective mix of dividend income generation (Dividend Yield [TTM] of 3.39%) with its potential for dividend growth (10 Year Dividend Growth Rate [CAGR] of 11.39%).
The largest individual positions in this portfolio are Apple (with 5%), Realty Income (with 4%), and Microsoft (4%). They are followed by Nike (3%), American Express (3%), and Visa (3%). From my perspective, each of these picks has favorable risk-reward profiles, which is why they occupy a relatively high share compared to the overall portfolio.
All other companies represent less than 3% of the overall portfolio, further validating its reduced risk-level and increased likelihood of producing favorable investment results.
Source: The Author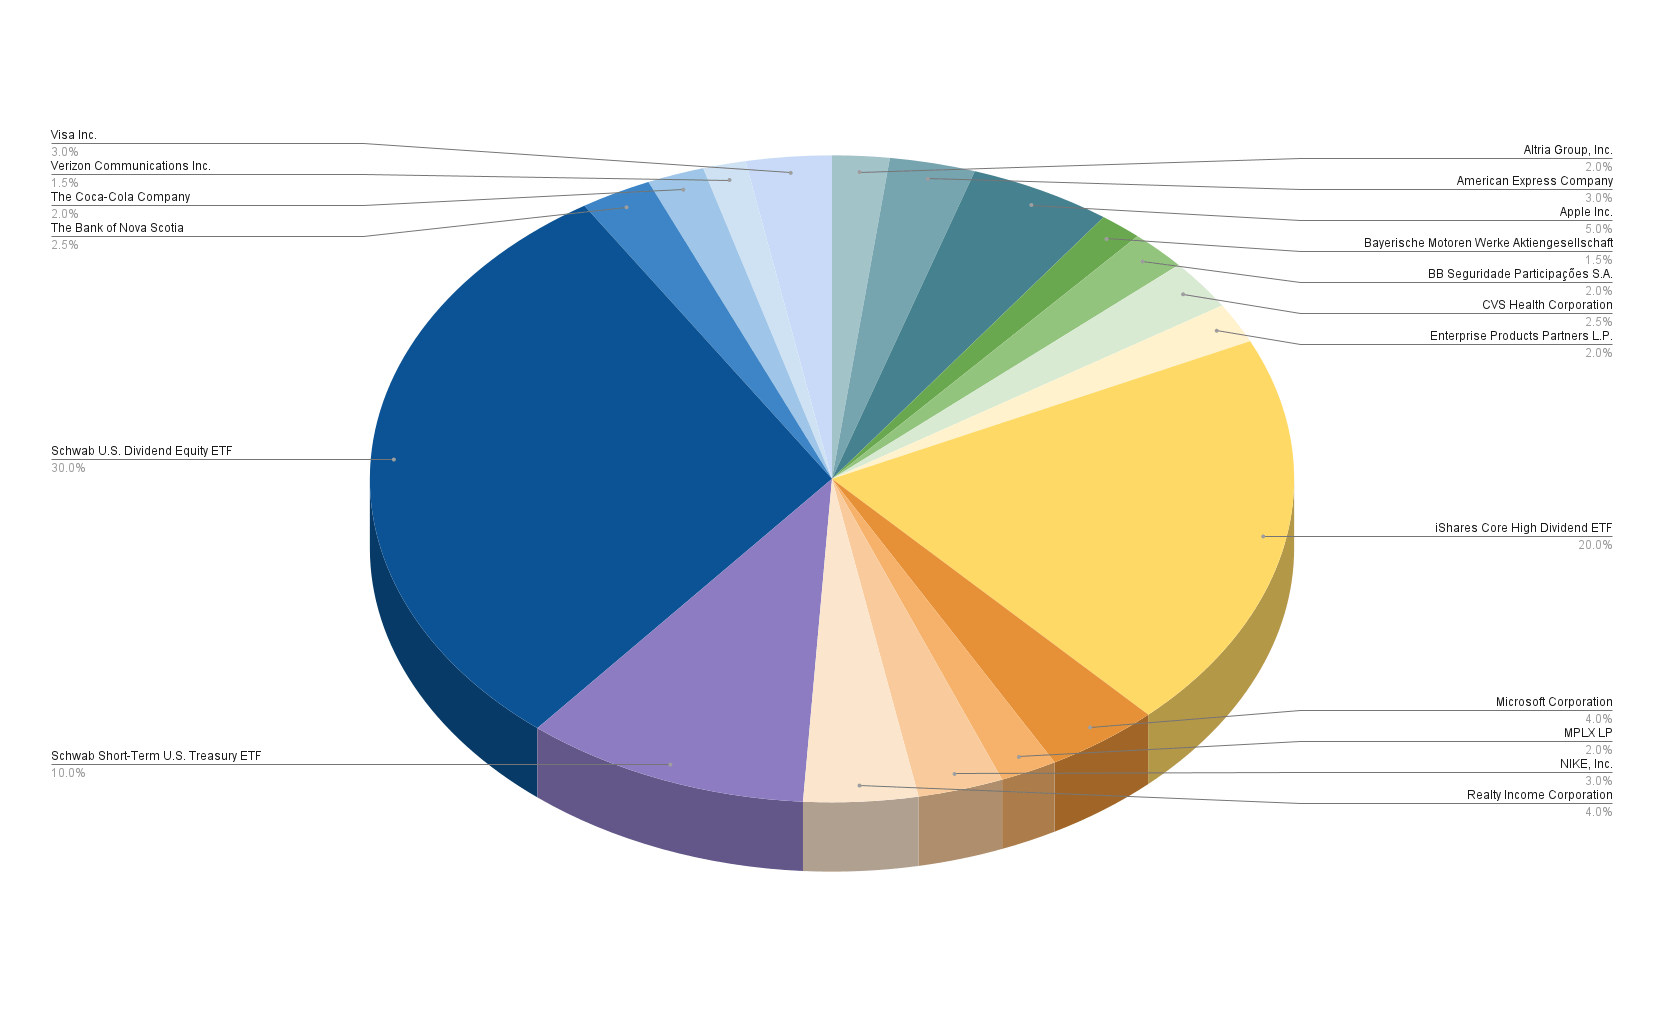
Risk Analysis of the Company-Specific Concentration Risk When Allocating SCHD and HDV Across their Respective Companies
By allocating SCHD and HDV among their respective equities, the graphic below highlights the reduced company-specific concentration risk of this dividend portfolio.
It is worth highlighting that Apple represents the largest position, accounting for 5% of the overall portfolio, followed by Realty Income (4%), Microsoft (4%), Coca-Cola (3.87%), Verizon (3.82%), and Altria (3.37%).
Visa, Nike, and American Express each account for 3% of the overall portfolio, while all other companies account for less than 3%.
Source: The Author, data from Seeking Alpha and Morningstar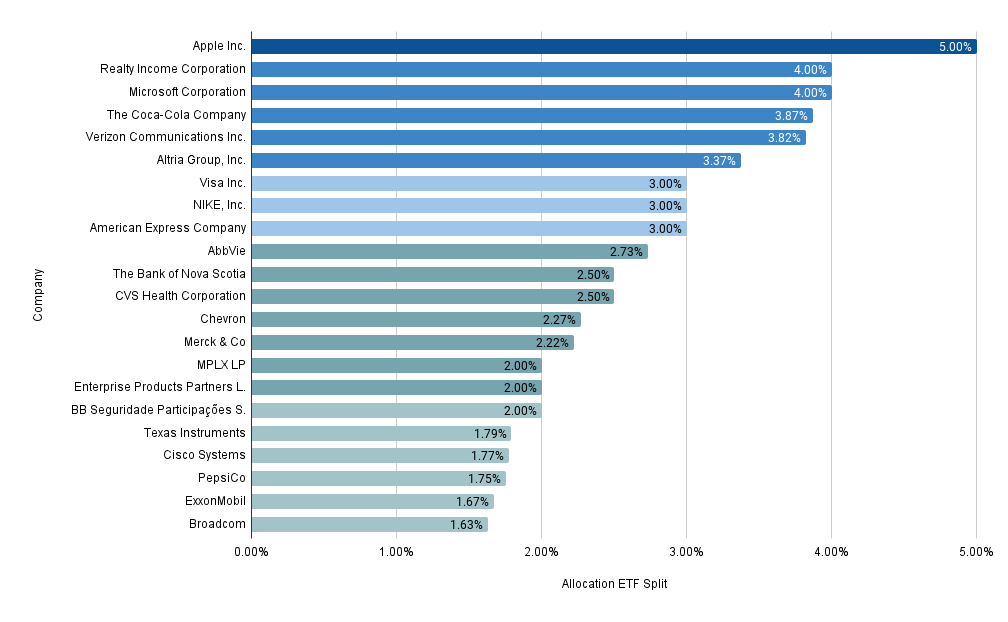
The graphic underscores my deliberate selection of companies, taking into consideration that some are already constituents of SCHD and HDV, thus ensuring the portfolio avoids excessive company-specific concentration risk.
Coca-Cola, Verizon and Altria account for a significant proportion of this portfolio. This is due to the fact they are individual positions as well as being part of SCHD and HDV. By assigning them a smaller allocation as individual positions, I have ensured that their overall composition does not exceed 4%.
Risk Analysis of the Portfolio’s Sector-Specific Concentration Risk When Distributing SCHD and HDV Across their Respective Sectors
The illustration below demonstrates that the Financials Sector represents the largest sector, accounting for 18.94% of the overall portfolio.
With 16.66%, the Information Technology Sector represents the second-largest sector.
The third largest is the Health Care Sector (with 13.34%), followed by the Energy Sector (12.27%), the Consumer Staples Sector (12.17%), the Consumer Discretionary Sector (8.52%), and the Industrials Sector (5.93%).
The Communication Services Sector (4.49%), the Real Estate Sector (4.45%), the Utilities Sector (2.15%), and the Materials Sector (1.08%) each account for less than 5% of the overall portfolio.
Source: The Author, data from Seeking Alpha and Morningstar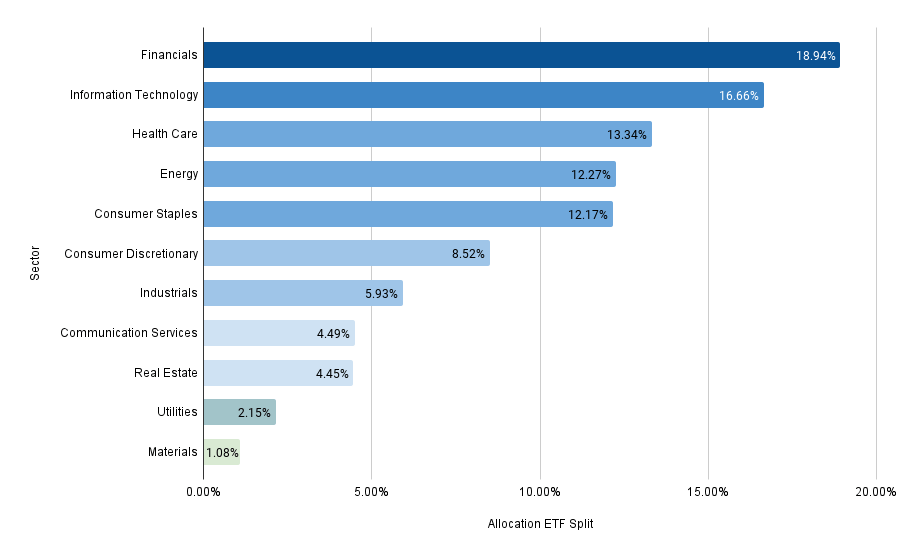
This allocation strategy, which limits any sector to a maximum of 20%, further signals the reduced risk associated with this dividend portfolio, thus enhancing the likelihood of successful investment outcomes.
Risk Analysis: Analyzing the 5 Largest Positions of This Dividend Portfolio
Analysis of the EBITDA Margin of the 5 Largest Positions
The graphic below illustrates the EBITDA Margins of the five largest individual positions of this dividend portfolio (when allocating SCHD and HDV across their respective companies).
The chart further emphasizes the robust Profitability and highlights the superior competitive position that each of the five largest holdings have within their respective industry.
From the five largest holdings that are part of this dividend portfolio, Microsoft exhibits the highest EBITDA Margin (44.59%), followed by Realty Income (42.26%), and Apple (30.76%).
Only Coca-Cola (EBITDA Margin of 29.10%) and Verizon (22.59%) have slightly lower EBITDA Margins, still exceeding 20%.
Source: The Author, data from Seeking Alpha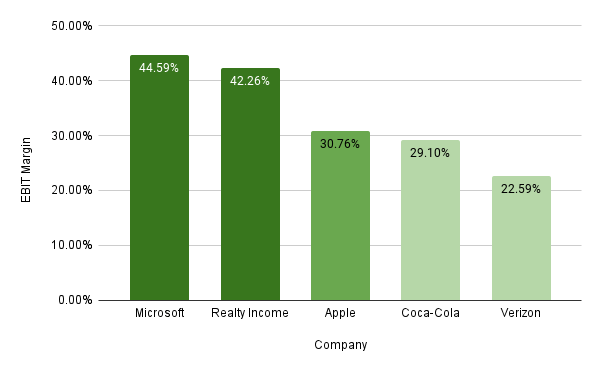
Analysis of the Consecutive Years of Dividend Growth Rates of the 5 Largest Positions of This Portfolio
The illustration below highlights the number of consecutive years of dividend growth of the five largest individual positions that are part of this dividend portfolio.
It is notable that Coca-Cola has achieved 61 consecutive years of dividend growth, followed by Realty Income with 26 years, while both Microsoft and Verizon have 19 years each. Apple, meanwhile, has recorded 10 consecutive years of dividend growth.
Source: The Author, data from Seeking Alpha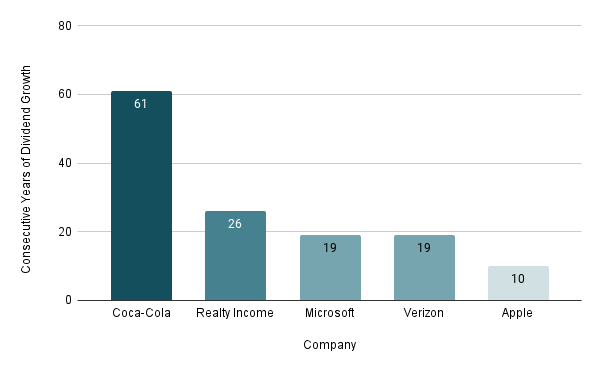
This graphic showcases the portfolio’s dual capability of offering both immediate dividend income and the potential for dividend growth, which is important for steadily increasing the amount of extra income via dividends on an annual basis.
Analysis of the Credit Rating from Moody’s of the 5 Largest Positions
The table below underscores the portfolio’s potential to prioritize capital preservation. This is important for reducing the chances of experiencing a loss with your investment portfolio.
Two of the five largest positions of this dividend portfolio exhibit an Aaa credit rating from Moody’s: both Apple and Microsoft have the highest possible credit rating from the agency.
Coca-Cola exhibits an A1 credit rating from Moody’s and Realty Income an A3 rating. Verizon showcases a Baa1 credit rating.
|
Company |
Credit Rating from Moody’s |
|
Apple |
Aaa |
|
Microsoft |
Aaa |
|
Coca-Cola |
A1 |
|
Realty Income |
A3 |
|
Verizon |
Baa1 |
Source: Moody’s
Risk Analysis of the Geographical Diversification of This Dividend Portfolio
The illustration below showcases this dividend portfolio’s geographical diversification: while 94% is allocated to companies from the United States, 2.5% has been allocated to a company from Canada (The Bank of Nova Scotia), 2% to a firm from Brazil (BB Seguridade Participações S.A) and 1.5% to a company from Germany (Bayerische Motoren Werke). The geographical diversification of this portfolio provides another indicator of its reduced risk level.
Source: The Author, data from Seeking Alpha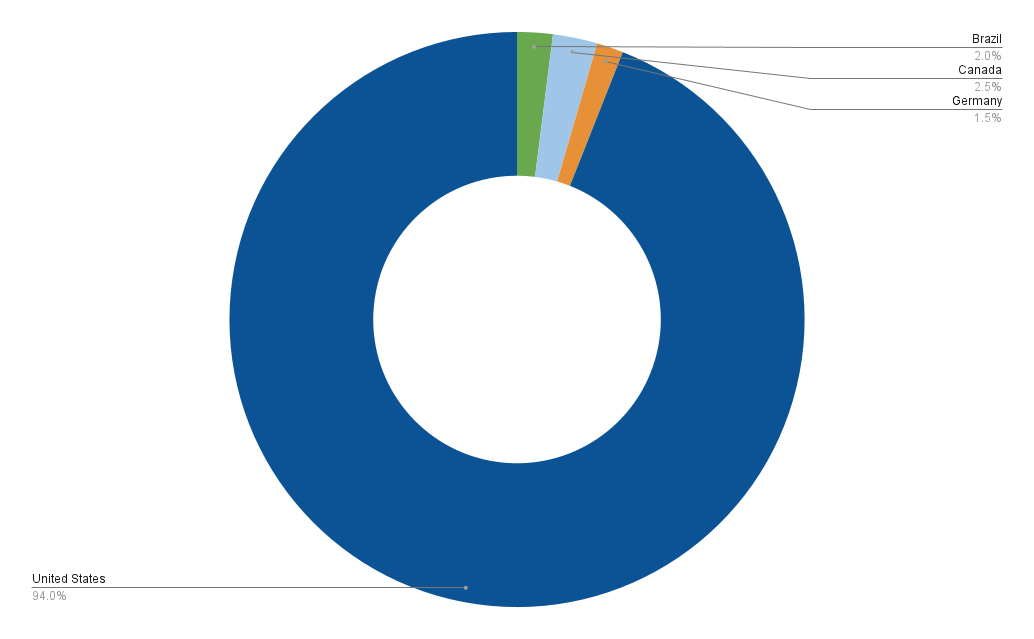
Conclusion
The dividend portfolio presented in this article distinguishes itself through a strategic blend of dividend income and growth. Moreover, it has a minimized risk level, which enhances the probability of successful investment outcomes. The portfolio consists of my top 10 high dividend yield companies for March 2024, as well as five companies with a focus on dividend growth, and three ETFs.
The portfolio’s Combined Weighted Average Yield of 3.58% demonstrates its ability to generate income through dividends and interest for you.
The lower risk profile is evidenced by its diversification: no individual position exceeds 5% and no sector comprises more than 20%.
The portfolio’s reduced risk level is further evidenced by the high EBITDA Margins of the five core holdings: Apple, Realty Income, Microsoft, Coca-Cola, and Verizon showcase an EBITDA Margin above 20%. It is further proven by their credit ratings from Moody’s (Apple and Microsoft exhibit the highest possible Aaa credit ratings) and strong track record of dividend growth: the five largest holdings have shown between 10 (Apple) and 61 (Coca-Cola) consecutive years of dividend growth.
Thanks to the immediate income received via dividends and interest payments, this portfolio can enhance your lifestyle, even funding a trip to your favorite team’s next football, baseball, or basketball game with your best friends. Given the attractive risk-reward profile of the chosen companies, such a strategically built portfolio also effectively blends dividend income and dividend growth while offering an elevated chance of producing positive investment results.
Editor’s Note: This article discusses one or more securities that do not trade on a major U.S. exchange. Please be aware of the risks associated with these stocks.

 Q2 2024 Earnings Call Transcript")

