Unlock the Editor’s Digest for free
Roula Khalaf, Editor of the FT, selects her favourite stories in this weekly newsletter.
Last week we wrote about how the BIS thinks the explosion of structured products like ETFs built for derivatives-derived income could be the real cause for the decline in the Vix. The volatility index’s parent now begs to differ.
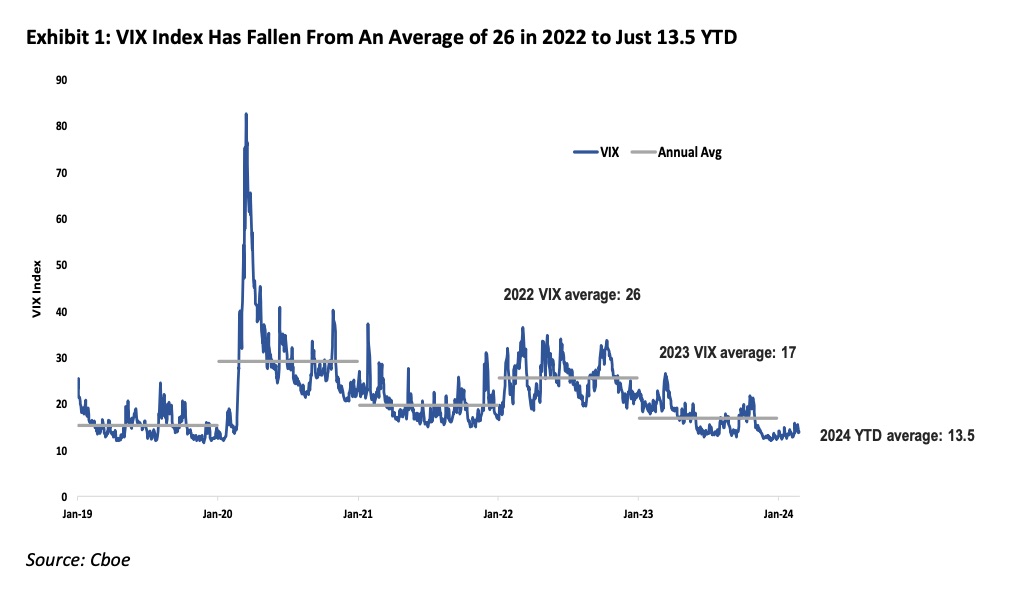
The Cboe — formerly known as the Chicago Board Options Exchange — has put out a report examining the decline in the volatility measured by its flagship Vix index, which it admits “has not only been historic, but also surprising”.

Cboe’s Mandy Xu (previously head of equity derivatives strategy at Credit Suisse) also concedes that the growth in derivatives-based income funds has been “jaw-dropping”. With assets under management jumping from $20bn in 2019 to over $120bn today “these funds are a behemoth in the derivatives market”.
Xu wonders why options-based yield-enhancement funds are growing so quickly, given that the ZIRP era is over and Treasury bills now give you 5 per cent a year. It’s something Alphaville had also be wondering, but a quick look at the distributed yield of Global X’s $8bn Nasdaq 100 Covered Call ETF gave us the answer.
At nearly 12 per cent it dwarfs the 7.5 per cent that US high-yield bonds pay, and is close to the effective yield of super-junky triple-C bonds. In other words, these products should probably be seen as a manifestation of risk-on in the new bull market, rather than a defensive play on yield. History is not kind on these kinds of de facto short-vol trades, even if this manifestation is somewhat different.
But are they to blame for the suppression of volatility, as the BIS suggested in its latest quarterly review? No, argues Xu:
First, it’s important to note that not all these funds deploy the same strategy. While some overwrite on the S&P 500® index, others overwrite on the Russell 2000 or Nasdaq 100 indices, or even single stocks and sectors (not surprisingly, mega-cap Tech buy-write funds have been particularly popular recently). The tenor and strike of the options sold also differ, from at-the-money to 25-30 delta OTM options, and ranging from weekly (or even daily) expiries all the way out to 3-months tenors. Thus only a fraction of overall AUM is deployed in strategies that have a direct impact on the VIX® index (e.g. 1-month over/underwriting strategies on the S&P 500 index). The diversity in underlying, tenor, and strike selection means the overall impact on the volatility surface is likely to be quite diluted vs. if these funds were all acting as a monolith.
Second, if volatility selling strategies were to blame for the low levels of the VIX index, you would expect the volatility risk premium (VRP) to shrink as the implied-realized volatility spread narrows (i.e. the VRP is what option sellers aim to monetize and thus should decrease as more sellers enter into the market). Instead, what we’ve seen over the past year is the opposite — the S&P 1M volatility risk premium (as measured by the difference between the VIX index vs SPX 1M realized volatility) actually increased quite meaningfully, from 1.5% in 2022 to 3.6% in 2023. Implied volatility may be low, but it’s not trading particularly cheap compared to realized volatility (SPX 1M realized vol went from averaging 24% in 2022 to just 13% in 2023).
Third, if buy-write strategies were distorting the market, we should see very low levels of call skew (defined as the difference in implied volatility between OTM call options vs. ATM call options) as selling pressure on OTM calls depress their volatility relative to ATM options. Instead, what we see is very much the opposite. SPX® call skew (25- delta call vs. 50-delta call) is trading near historic highs across a number of tenors on the back of elevated demand for upside calls, with 3M call skew recently surging to a 10-year high. The dominant force in the derivatives market right now is upside call buyers, not sellers, as investors use options to tactically increase their leverage to the equity market.
TL;DR: The size of funds that directly affect the Vix calculation is too modest, and if they were to blame you’d see a very different pattern in options prices.
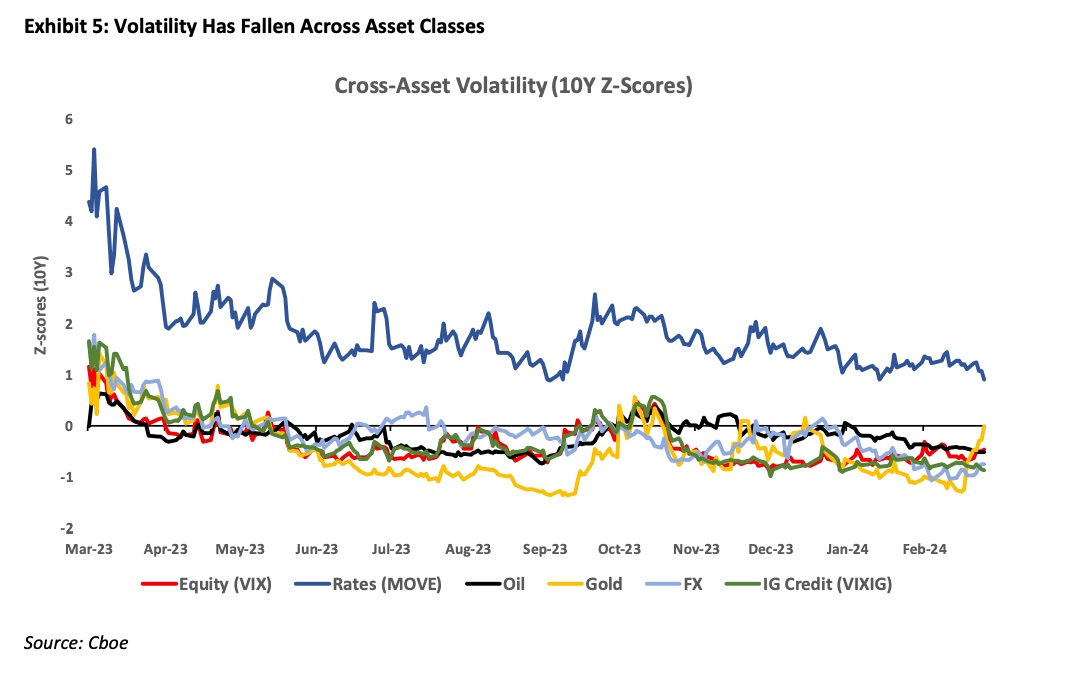
So what is to blame? Xu points out that low volatility is not just an equity market phenomenon. Even rates volatility — actual and implied — has fallen sharply from the highs of 2022. That implies that the fundamental driver is economic in nature, she argues.
More specifically, it’s the positive turn in the economic outlook as investors went from fearing a recession to now expecting a soft landing. The “immaculate disinflation” that many economists warned was impossible turned out to be very much possible — and that in turn has led to a decline in volatility across every asset class.

Rocky Fishman — a former crack derivatives analyst at Deutsche Bank and Goldman Sachs who now runs his own research outfit Asym500 — strikes a somewhat different note in his own examination of the option-driven fund phenomenon, even if he broadly agrees with the thrust of Xu’s argument.
Basically, Fishman thinks that their dramatic growth — he estimates their overall AUM at ca $400bn if you include products like variable annuities — means they “a stabilising influence”, but that their importance is still overstated.
At the most basic level, option-driven funds as a group are unlevered, hedged option sellers, and therefore are more likely to contribute to market stability than to exacerbate moves. We see them as hedged because they typically own stock corresponding to the call options they have sold. In typical severe selloffs, most funds’ investors are likely to lose less money than outright equity investors would, and their portfolio managers are not likely to make major changes to portfolio structure. The market makers and dealers to whom the funds have sold options would be long gamma, meaning that they would be buying equities in a typical selloff. However, there is a limit to how much this matters. $400bln of AUM is less than 1% of the SPX’s market cap, and the delta swings are far smaller.
That said, volatility has not been exceptionally low during the period when these funds have been growing. SPX realized volatility was very high (24%) in 2022, and only moderately below its historical median (13%) in 2023, and the VIX has been following its typical post-crisis pattern of gradual vol risk premium normalization. Market impact from the option-driven funds is more likely to be visible in nuanced vol-market metrics (e.g. correlation) than in overall market volatility.

 Q2 2024 Earnings Call Transcript")

