Daniel Balakov
Extra Space Storage (NYSE:EXR) is a Real Estate Investment Trust that is currently yielding 4.52%. EXR is based out of Utah and operates in 42 states plus Washington D.C. In this article I will outline why I think now is a good time to buy EXR and capture the high yield along with an excellent opportunity for capital gains. My analysis will involve looking at weekly charts for price action, momentum, volume, and relative strength. I will also provide a risk management plan in case my analysis proves incorrect. Let’s look at Chart 1.
Chart 1 – EXR Weekly with 30-Week Moving Average, Momentum, Volume, and Relative Strength
www.stockcharts.com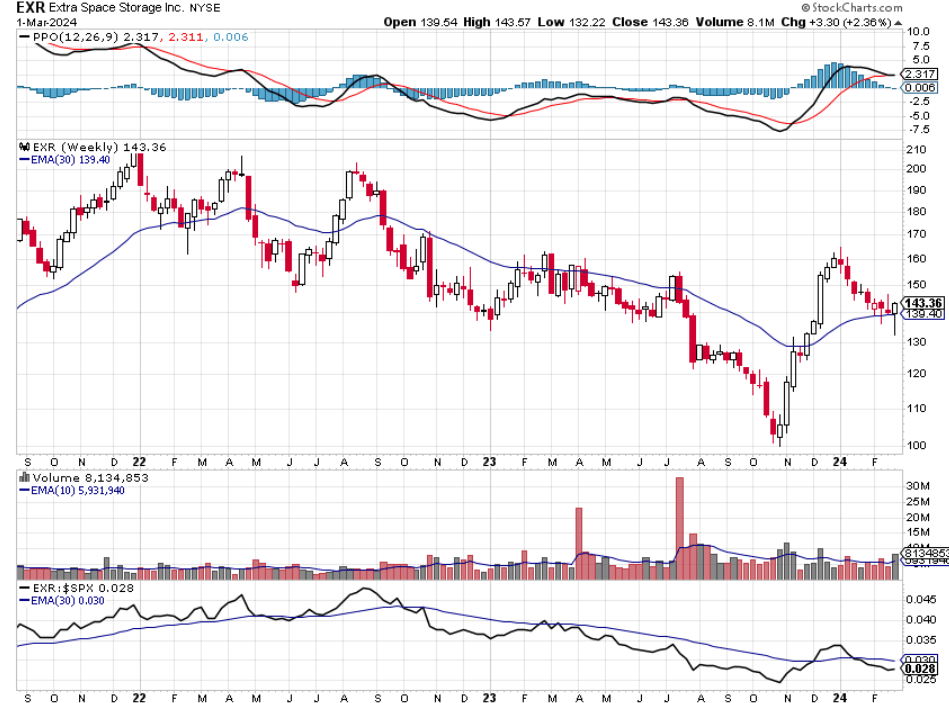
Whenever I look at investment ideas, I always start with a weekly price chart. The daily charts are just too noisy for me. The weekly chart along with the 30-week exponential moving average (EMA) offers me the right perspective for my timeframe, which is intermediate to long term. Looking at the upper left-hand corner of Chart 1 you can see that EXR traded as high as $211.54 in late December 2021. EXR then sold off to $162.02 in February 2022. Then EXR rallied up to $207.13 in April 2022. The fact that EXR couldn’t get above its high set in December 2021 should have given investors in EXR pause. I say that because I want to own stocks that are trending higher. A higher trending stock is a stock that is making a series of higher high prices, and higher low prices. This is also a stock that is trading above its upward trending 30-week EMA. Instead, EXR is doing the opposite. It couldn’t exceed its December 2021 high, and the subsequent decline to $147.46 in June 2022, is now a lower low compared to the low in February 2022. EXR is now trading below its downward trending 30-week EMA. EXR did fight its way back above the 30-week EMA, but it couldn’t hold above the EMA, and it again put is a lower high. This series of lower highs and lower lows didn’t end until the price low of $100.07 in October 2023. Since then, price action has turned bullish in my opinion. EXR had a strong rally that cleared its 30-week EMA and put in a higher high of $164.99 in January 2024. That high price was higher than the previous high of $155.16 in July 2023. The decline from the January 2024 high was orderly, which is encouraging. Price declined but stayed above the 30-week EMA. Twice price penetrated the 30-week EMA, but each time, bulls stepped in a moved the price higher. The price action for EXR I see as bullish as price is now putting in a series of higher lows and higher highs, while price is above an upward trending 30-week EMA.
Along with price action, I see momentum as bullish. Momentum is shown in the top pane of Chart 1. The Percentage Price Oscillator (PPO) shows momentum two different ways. When the black PPO line is above the red signal line that is an indication of short-term bullish momentum. Short-term bearish momentum is when the black PPO line is below the red signal line. The second way PPO shows momentum is with long-term momentum. When the black PPO line is above zero or the center line of the chart, then PPO displays long term bullish momentum. I say this is long term because PPO doesn’t normally oscillate back and forth above or below zero or the center line. Usually, PPO stays above or below zero for long periods of time. Right now, the black PPO line is reading 2.317 which is above zero. I want to own stocks that are displaying bullish momentum. I use PPO as a confirmation tool. Notice that during EXR’s major price decline, the black PPO line was below zero or the center line for most of that decline, confirming the downtrend. Momentum is bullish for EXR confirming the recent bullish price action.
Volume is the next part of my analysis. Looking at the volume graph, you can see that since the bottom in October 2023, the black bars have been taller than the red bars. This means that more volume has happened during weeks when the price advanced. The big black bars represent institutional money. Smart money. These players only buy stock when they think it is undervalued, and they buy for the long term. I am also encouraged by last week’s price action. Notice the big black bar showing us that institutions bought the most recent decline in EXR. I want to own stocks that are supported by smart money and I see the volume pattern as bullish.
Relative strength is the next part of my analysis. I want to own stocks that are outperforming the SP 500 index. The relative strength line is a ratio of the price of EXR to the price of the SP 500 index. When the black line is rising, that tells us that EXR is outperforming the SP 500 index. When the black line is falling, that tells us that EXR is underperforming the SP 500 index. Notice the relative strength line during the long price decline. EXR underperformed. Now things may be changing. The relative strength line is higher than it was in November of last year, saying that EXR has outperformed the major index. Now the relative strength line looks to be turning higher. While this is the least bullish signal of my analysis, this could improve quickly.
Whenever I buy a stock, I first think of preserving my capital. Any number of things could affect my analysis. The next earnings report could be disappointing, interest rates could move higher, there could be some damaging economic reports, or there could be some major geopolitical event that takes place. I can’t predict any of those things, which is why I choose to use technical analysis when I select stocks to buy. I simply try to own stocks in an uptrend. Since any of these events could drive the price of EXR lower, I need to have an exit plan. If the stock goes against me, I simply want to exit my position, take my small loss, and preserve most of my capital for my next idea. Often, I simply use any weekly close below the 30-week EMA as a time to exit. For this setup in EXR, I am looking at a close below last week’s low price of $132.22. That is roughly an 8% loss from the current price. That is a manageable loss to me. I also consider the most recent high price of $164.99 to be an initial target price from here. That is a 15% increase from the current price. This risk management plan then offers a roughly 1:2 risk to reward ratio.
In summary, EXR is a high yielding dividend payer that offers an attractive entry price for the intermediate to long term time frame. This gives investors both a high yield and the opportunity for capital gains. It has bullish price action and is trading above its upward trending 30-week EMA. Momentum is bullish for both the short-term and long term. Volume indicates that smart money has been accumulating the stock presumably because they believe that EXR is undervalued at current prices. Relative strength continues to improve and may be turning higher. Lastly, EXR offers a good entry level that provides a 1:2 risk to reward ratio, which is attractive.

 Q2 2024 Earnings Call Transcript")

