TERADAT SANTIVIVUT
Dear Shareholders:
Performance Overview
Source Capital Inc.’s (SOR) (“Source” or “Fund”) net asset value (NAV) gained 6.57% in the fourth quarter and 16.74% for the trailing twelve months, which is favorable when compared to the illustrative balanced indices shown below.
|
Performance Versus Indices1 |
||
|
Q4 2023 |
Trailing 12-month |
|
|
Source Capital (NAV) |
6.57% |
16.74% |
|
Balanced Indices |
||
|
60% MSCI ACWI/40% Bloomberg US Agg |
9.36% |
15.37% |
|
60% S&P 500/40% Bloomberg US Agg |
9.74% |
17.67% |
|
Equity Index |
||
|
MSCI ACWI |
11.03% |
22.20% |
We include the Fund’s underlying exposure by asset class in the following table:
|
Portfolio Exposure2 |
|
|
Q4 2023 |
|
|
Equity |
|
|
Common Stocks |
40.3% |
|
Common Stocks-SPACs |
0.0% |
|
Total Equity |
40.3% |
|
Credit |
|
|
Public |
27.6% |
|
Private (Invested assets only) |
17.7% |
|
Total Credit |
45.3% |
|
Other |
0.1% |
|
Cash |
14.3% |
|
Total |
100.0% |
Portfolio discussion
Equity
A small number of mega-cap companies drove stock prices last year. The “Magnificent Seven” stocks (Apple (AAPL), Alphabet (GOOG), Microsoft (MSFT), Amazon.com (AMZN), Meta Platforms (META), Tesla (TSLA), and Nvidia (NVDA)) ended the year with an aggregate market cap of almost $12 trillion, more than the U.K., Canadian, and Japanese stock markets combined.3 Their 111% return in 2023 accounted for approximately 75% of the 26.3% total return in the S&P 500. The average stock delivered a much lower return, with the equal-weighted S&P 500 gaining just 10.4%.
We believe our time is best spent deliberating about whether the companies in the portfolio and those in consideration will meet our expectations over time rather than trying to ascertain what inflation or interest rates might do, who might win the next election, etc. – focusing on bottom-up, rather than top-down analyses.
Source’s top five equity performers contributed 4.92% to its return in the previous twelve months, while its bottom five detracted 0.55%.
We list the top equity contributors to and detractors from the Fund’s trailing twelve-month returns below.
Trailing Twelve-Month Contributors and Detractors as of December 31, 20234
|
Contributors |
Perf. cont. |
Avg. % of Port |
Detractors |
Perf. cont. |
Avg. % of Port |
|
|
Holcim |
1.35% |
2.60% |
Int’l Flavors and Fragrances |
-0.29% |
1.60% |
|
|
Meta Platforms |
1.00% |
1.00% |
Nexon |
-0.08% |
0.40% |
|
|
Alphabet |
0.97% |
2.00% |
FirstEnergy |
-0.08% |
0.80% |
|
|
Broadcom |
0.93% |
1.20% |
JDE Peet’s |
-0.05% |
1.00% |
|
|
Comcast |
0.67% |
2.50% |
Entain |
-0.05% |
0.20% |
|
|
4.92% |
9.3% |
-0.55% |
3.9% |
We have not recently discussed the following investments meaningful to the Fund’s trailing twelve-month return.5
Meta saw a welcome recovery in engagement and revenue year-to-date following a tough 2022. The company has continued to offer new solutions that allow advertisers to target customers effectively and efficiently via one of the world’s leading digital platforms. Moreover, operating profits are rising due to an organization-wide focus on improving productivity and accelerating the time to market for new products. However, overall profitability continues to be weighed down by losses in the Reality Labs segment. But, there is positive optionality that Meta will emerge from the AI arms race as one of the leading players in the industry.
FirstEnergy is an Ohio-based public utility holding company that we purchased in 2020 in the face of a bribery scandal. The company paid fines, and senior management changed as a result; since then, the company has performed well operationally, which has translated into good stock performance. While increasing interest rates in 2023 caused its stock to drop from its highs (along with the Interest Rate Caps), it continues to trade at a substantial discount to its peers and offers a 4.5% dividend yield.
You can find many of the Fund’s other positions addressed previously in ourarchived commentaries.
Fixed Income
Traditional
In the high-yield market, yields remain near 15-year highs. Still, spreads have tightened, as shown in the following chart, which measures the BB component of the high-yield index, excluding energy, an index we believe gives the most consistent data over time with fewer distortions caused by changes in the composition of the overall high-yield index.
Bloomberg US Corporate High-Yield BB excluding Energy Yield-To-Worst (YTW) and Spread6
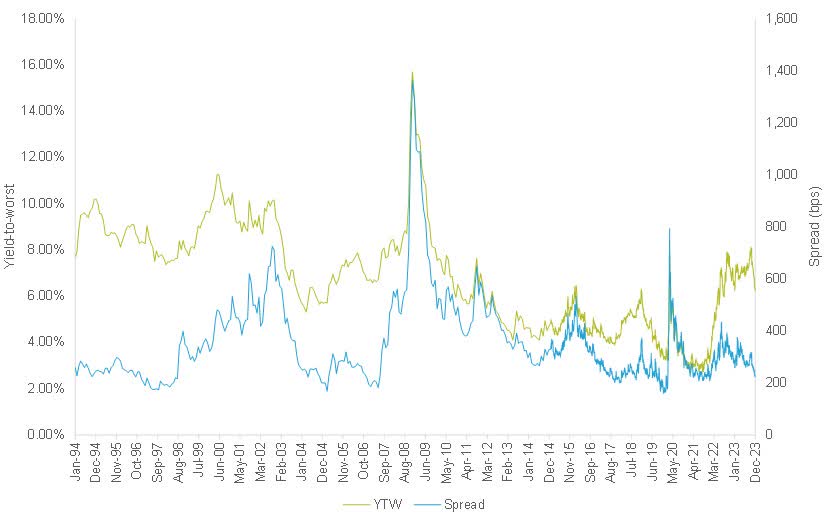
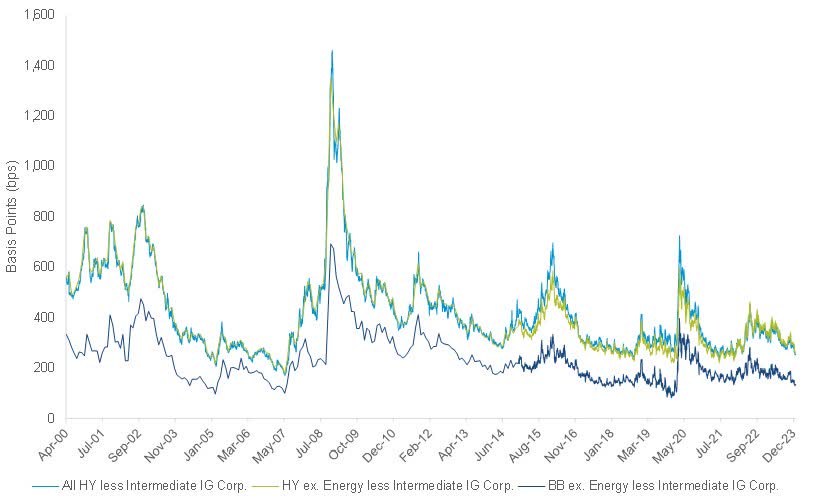
Though yields in the high-yield market are in the realm of 15-year highs, we generally find that, compared to investment-grade bonds, the low spreads in the high-yield market do not offer enough incremental compensation for the extra credit risk. The following chart shows the spread of high-yield debt less the spread of investment-grade corporate debt. This incremental spread represents the extra yield offered in exchange for taking on more credit risk. This spread is currently in the 6th to 15th percentile of the history, which means that investors are getting paid relatively little to take on the extra credit risk associated with high-yield debt.7
Bloomberg US High-Yield Index spread less Bloomberg Investment Grade Corporate spread8
We continue to research the high-yield market for investment opportunities, but these days we typically find that high yield is not worth the risk.
Private Credit
Source’s allocation to private credit remains high. If all commitments were drawn today, that exposure would be 26.5%.
Corporate and Other Matters
Distribution
On December 7, 2023, the Fund’s Board approved maintaining the Fund’s regular monthly distribution at the current rate of 20.83 cents per share through February 2024.9 This equates to an annualized 6.19% unlevered distribution rate based on the Fund’s closing market price on December 29, 2023.
Share Buyback
The Fund repurchased 13,333 shares during the quarter, representing 0.16% of the outstanding shares, at an average price of $39.02 per share and an average discount to NAV of 8.60%.10
Closing
We have been around long enough not to get so excited about a good year, knowing that a bad year might be just a flip of the calendar away. After one has strung together the good, the bad, and the ugly years, we hope to have delivered good risk-adjusted returns by investing globally in various asset classes. But, as Clint Eastwood’s Blondie character from The Good, the Bad, and the Ugly aptly said, “We’re gonna have to earn it.”
Respectfully submitted,
Source Capital Portfolio Management Team
February 15, 2024
Important Disclosures
This Commentary is for informational and discussion purposes only and does not constitute, and should not be construed as, an offer or solicitation for the purchase or sale with respect to any securities, products or services discussed, and neither does it provide investment advice. This Commentary does not constitute an investment management agreement or offering circular.
Current performance information is updated monthly and is available by calling 1-800-982-4372 or by visiting Investors First | Investment Management from First Pacific Advisors. Performance data quoted represents past performance, which is no guarantee of future results. Current performance may vary from the performance quoted. The returns shown for Source Capital are calculated at net asset value per share, including reinvestment of all distributions. Returns do not reflect the deduction of taxes that a shareholder would pay on Fund distributions, which would lower these figures. Since Source Capital is a closed-end investment company and its shares are bought and sold on the New York Stock Exchange, your performance may also vary based upon the market price of the common stock.
The Fund is managed according to its investment strategy, which may differ significantly in terms of security holdings, industry weightings, and asset allocation from those of the comparative indices. Overall Fund performance, characteristics and volatility may differ from the comparative indices shown.
There is no guarantee the Fund’s investment objectives will be achieved. You should consider the Fund’s investment objectives, risks, and charges and expenses carefully before you invest. You can obtain additional information by visiting the website at Investors First | Investment Management from First Pacific Advisors, by email at crm@fpa.com, toll-free by calling 1-800-982-4372 or by contacting the Fund in writing.
The views expressed herein, and any forward-looking statements are as of the date of this publication and are those of the portfolio management team. Future events or results may vary significantly from those expressed, and are subject to change at any time in response to changing circumstances and industry developments. This information and data has been prepared from sources believed reliable, but the accuracy and completeness of the information cannot be guaranteed and is not a complete summary or statement of all available data.
Portfolio composition will change due to ongoing management of the Fund. References to individual financial instruments or sectors are for informational purposes only and should not be construed as recommendations by the Fund or the portfolio managers. It should not be assumed that future investments will be profitable or will equal the performance of the financial instrument or sector examples discussed. The portfolio holdings as of the most recent quarter-end may be obtained atwww.fpa.com.
Investing in closed-end funds involves risk, including loss of principal. Closed-end fund shares may frequently trade at a discount (less than) or premium (more than) to their net asset value. If the Fund’s shares trade at a premium to net asset value, there is no assurance that any such premium will be sustained for any period of time and will not decrease, or that the shares will not trade at a discount to net asset value thereafter.
Capital markets are volatile and can decline significantly in response to adverse issuer, political, regulatory, market, or economic developments. It is important to remember that there are risks inherent in any investment, and there is no assurance that any investment or asset class will provide positive performance over time.
The Fund may purchase foreign securities, including American Depository Receipts (ADRS) and other depository receipts, which are subject to interest rate, currency exchange rate, economic and political risks; these risks may be heightened when investing in emerging markets. Non-U.S. investing presents additional risks, such as the potential for adverse political, currency, economic, social or regulatory developments in a country, including lack of liquidity, excessive taxation, and differing legal and accounting standards. Non-U.S. securities, including American Depository Receipts (ADRS) and other depository receipts, are also subject to interest rate and currency exchange rate risks.
The return of principal in a fund that invests in fixed income instruments is not guaranteed. The Fund’s investments in fixed income instruments have the same issuer, interest rate, inflation and credit risks that are associated with underlying fixed income instruments owned by the Fund. Such investments may be secured, partially secured or unsecured and may be unrated, and whether or not rated, may have speculative characteristics. The market price of the Fund’s fixed income investments will change in response to changes in interest rates and other factors.
Generally, when interest rates go up, the value of fixed income instruments, such as bonds, typically go down (and vice versa) and investors may lose principal value. Credit risk is the risk of loss of principle due to the issuer’s failure to repay a loan. Generally, the lower the quality rating of an instrument, the greater the risk that the issuer will fail to pay interest fully and return principal in a timely manner. If an issuer defaults, the security may lose some or all its value. Lower rated bonds, convertible securities and other types of debt obligations involve greater risks than higher rated bonds.
Mortgage-related and asset-backed securities are subject to prepayment risk, can be highly sensitive to changes in interest rates, and are subject to credit risk/risk of default on the underlying assets… Convertible securities are generally not investment grade and are subject to greater credit risk than higher-rated investments. High-yield securities can be volatile and subject to much higher instances of default. The Fund may experience increased costs, losses and delays in liquidating underlying securities should the seller of a repurchase agreement declare bankruptcy or default.
The ratings agencies that provide ratings are Standard and Poor’s, Moody’s, and Fitch. Credit ratings range from AAA (highest) to D (lowest). Bonds rated BBB or above are considered investment grade (IG). Credit ratings of BB and below are lower-rated securities (junk bonds). High-yielding, non-investment grade bonds (junk bonds) (HY) involve higher risks than investment grade bonds. Bonds with credit ratings of CCC or below have high default risk.
Private placement securities are securities that are not registered under the federal securities laws and are generally eligible for sale only to certain eligible investors. Private placements may be illiquid, and thus more difficult to sell because there may be relatively few potential purchasers for such investments, and the sale of such investments may also be restricted under securities laws.
The Fund may use leverage. While the use of leverage may help increase the distribution and return potential of the Fund, it also increases the volatility of the Fund’s net asset value (NAV), and potentially increases the volatility of its distributions and market price. There are costs associated with the use of leverage, including ongoing dividend and/or interest expenses. There also may be expenses for issuing or administering leverage. Leverage changes the Fund’s capital structure through the issuance of preferred shares and/or debt, both of which are senior to the common shares in priority of claims. If short-term interest rates rise, the cost of leverage will increase and likely will reduce returns earned by the Fund’s common stockholders.
Value style investing presents the risk that the holdings or securities may never reach their full market value because the market fails to recognize what the portfolio management team considers the true business value or because the portfolio management team has misjudged those values. In addition, value style investing may fall out of favor and underperform growth or other styles of investing during given periods.
Distribution Rate
Distributions may include the net income from dividends and interest earned by fund securities, net capital gains, or in certain cases it may include a return of capital. The Fund may also pay a special distribution at the end of a calendar year to comply with federal tax requirements. All mutual funds, including closed-end funds, periodically distribute profits they earn to investors. By law, if a fund has net gains from the sale of securities, or if it earns dividends and interest from securities, it must pass substantially all of those earnings to its shareholders, or it will be subject to corporate income taxes and excise taxes. These taxes would, in effect, reduce investors’ total return. First Pacific Advisors, LP does not provide legal, accounting, or tax advice.
The Fund’s distribution rate may be affected by numerous factors, including changes in realized and projected market returns, fund performance, and other factors. There can be no assurance that a change in market conditions or other factors will not result in a change in the Fund’s distribution rate at a future time.
Index Definitions
Comparison to any index is for illustrative purposes only and should not be relied upon as a fully accurate measure of comparison. The Fund may be less diversified than the indices noted herein, and may hold non-index securities or securities that are not comparable to those contained in an index. Indices will hold positions that are not within the Fund’s investment strategy. Indices are unmanaged and do not reflect any commissions, transaction costs, or fees and expenses which would be incurred by an investor purchasing the underlying securities and which would reduce the performance in an actual account. You cannot invest directly in an index. The Fund does not include outperformance of any index in its investment objectives.
S&P 500 Index includes a representative sample of 500 hundred companies in leading industries of the U.S. economy. The Index focuses on the large-cap segment of the market, with over 80% coverage of U.S. equities, but is also considered a proxy for the total market.
MSCI ACWI Index is a free float-adjusted market capitalization weighted index that is designed to represent the performance of the full opportunity set of large- and mid-cap stocks across developed and emerging markets. Net Return indicates that this series approximates the minimum possible dividend reinvestment. The dividend is reinvested after deduction of withholding tax, applying the rate applicable to non-resident individuals who do not benefit from double taxation treaties.
60% S&P 500/40% Bloomberg US Aggregate Bond Index is a hypothetical combination of unmanaged indices and comprises 60% S&P 500 Index and 40% Bloomberg Barclays US Aggregate Bond Index.
60% MSCI ACWI/40% Bloomberg US Aggregate Bond Index is a hypothetical combination of unmanaged indices and comprises 60% MSCI ACWI Index and 40% Bloomberg Barclays US Aggregate Bond Index.
Bloomberg US Aggregate Bond Index provides a measure of the performance of the US investment grade bonds market, which includes investment grade US Government bonds, investment grade corporate bonds, mortgage pass-through securities and asset-backed securities that are publicly offered for sale in the United States. The securities in the Index must have at least 1-year remaining in maturity. In addition, the securities must be denominated in US dollars and must be fixed rate, nonconvertible, and taxable.
Bloomberg US Corporate High-Yield BB excluding Energy measures the market of USD-denominated, non-investment grade, fixed-rate, taxable corporate bonds excluding the Energy sector.
Other Definitions
Discount to Net Asset Value (NAV) is a pricing situation when a closed-end fund’s market trading price is lower than its daily net asset value (NAV).
High Yield (HY) bond is a high-paying bond with a lower credit rating (S&P and Fitch, BB+ and lower; Moody’s, Ba1 or lower) than investment-grade corporate bonds, Treasury bonds and municipal bonds. Because of the higher risk of default, these bonds pay a higher yield than investment grade bonds.
Investment Grade (IG) is a rating (S&P and Fitch, BBB- and higher; Moody’s Baa3 and higher) that indicates that a bond has a relatively low risk of default.
Net Asset Value (NAV) represents the net value of a mutual fund and is calculated as the total value of the fund’s assets minus the total value of its liabilities and is shown as a per-share price.
Risk Assets are any asset that carries a degree of risk. Risk asset generally refers to assets that have a significant degree of price volatility, such as equities, commodities, high-yield bonds, real estate and currencies, but does not include cash and cash equivalents.
Spread reflects the quoted spread of a bond that is relative to the security off which it is priced, typically an on the-run treasury.
Yield is the discount rate that links the bond’s cash flows to its current dollar price.
Yield to Worst (YTW) is a measure of the lowest possible yield that can be received on a bond that fully operates within the terms of its contract without defaulting. It is a type of yield that is referenced when a bond has provisions that would allow the issuer to close it out before it matures
1. Comparison to the indices is for illustrative purposes only. An investor cannot invest directly in an index. Fund shareholders may only invest or redeem their shares at market value (SOR), which may be higher or lower than the Fund’s net asset value (NAV).
2. Source: FPA, as of December 31, 2023. Portfolio composition will change due to ongoing management of the Fund. Cash includes the non-invested portion of private credit investments. Totals may not add up to 100% due to rounding.
3. What I Learned This Week. 13D Research and Strategy. January 11, 2024.
4. Reflects the top five contributors and detractors to the Fund’s performance based on contribution to return for the trailing twelve months (“TTM”). Contribution is presented gross of investment management fees, transactions costs, and Fund operating expenses, which if included, would reduce the returns presented. The information provided does not reflect all positions purchased, sold or recommended by FPA during the quarter. A copy of the methodology used and a list of every holding’s contribution to the overall Fund’s performance during the TTM is available by contacting FPA Client Service at crm@fpa.com. It should not be assumed that recommendations made in the future will be profitable or will equal the performance of the securities listed.
5. The company data and statistics referenced in this section are sourced from company press releases and financial disclosures, unless otherwise noted.
6. Source: Bloomberg. As of December 29, 2023. Please see Important Disclosures for definitions of key terms.
7. Source: Bloomberg, FPA calculations. As of December 29, 2023.
8. Source: Bloomberg. As of December 29, 2023.
9. For more information related to the Fund’s distribution rate, please see the press releases dated December 7, 2023, and January 23, 2024. Dividends and other distributions are not guaranteed.
10. For more information related to the Fund’s share repurchase program, please see the press release dated January 2, 2024.
Past results are no guarantee, nor are they indicative, of future results
Editor’s Note: The summary bullets for this article were chosen by Seeking Alpha editors.

 Q2 2024 Earnings Call Transcript")

