Anadolu/Anadolu via Getty Images
By Darius Nass
The S&P Developed BMI Select Aerospace & Defense 35/20 Capped Index seeks to measure the performance of constituents from the S&P Developed BMI that are classified in the GICS Aerospace & Defense sub-industry, while adhering to certain size and liquidity criteria. It uses a capped float-market-capitalization-weighted methodology to ensure diversification across its constituents. It is reconstituted annually in September, with a monthly weight capping.
The Aerospace & Defense (A&D) sub-industry is unique, with the defense segment often exhibiting anti-cyclical behavior alongside increases in government defense spending, independent of economic downturns.1 In contrast, the aerospace segment, especially commercial aviation, is highly cyclical, closely tied to the broader economic cycle and consumer spending on travel.2 The reliance on long-term government contracts in defense introduces a degree of revenue stability, though it also poses risks tied to changes in political landscapes and defense budgets. Additionally, the A&D sector is often synonymous with technological innovation, contributing significantly to advancements in fields such as autonomous flight systems and cybersecurity, driven by the sector’s lengthy product development cycles and substantial investments in new technologies.3 Moreover, the industry is marked by high barriers to entry due to significant capital and technological requirements, high regulatory standards and the need for advanced R&D capabilities. This results in a concentrated competitive landscape with a few major players dominating the global scene.4
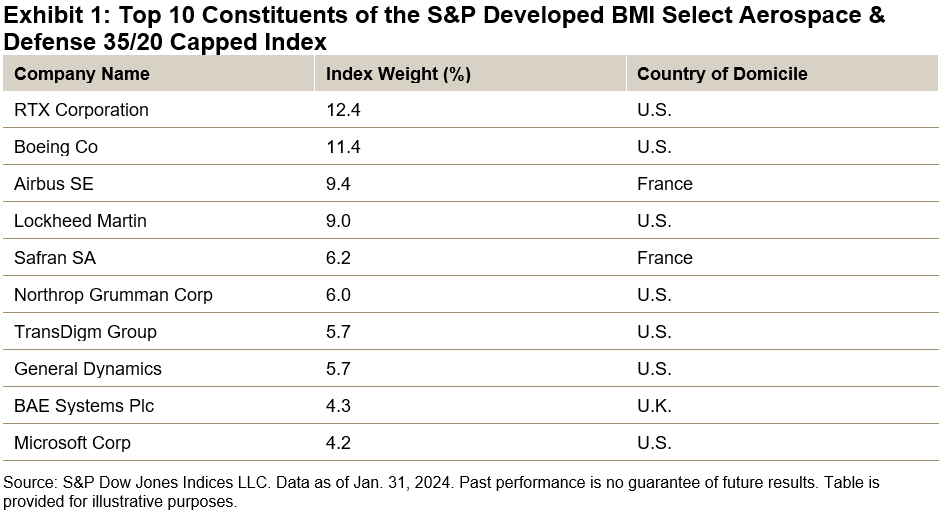
The dominance of a few key players in the Aerospace & Defense sub-industry is evident in the index’s composition, where over 90% of the companies have a market capitalization in excess of USD 10 billion. Among the 56 constituents of the index, the majority are based in the U.S. (67%), followed by France (17%) and the U.K. (9%). This distribution contrasts with its benchmark index, which also has 67% of its constituents domiciled in the U.S., but with a significantly lower representation from France (3%) and the U.K. (4%). The higher concentration in France is largely due to the inclusion of major French firms like Airbus and Safran, which hold index weights of 9.4% and 6.2%, respectively. In the U.K., a significant part of the index weight comes from Europe’s largest defense contractor, BAE Systems (index weight of 4.3%), and Rolls-Royce (index weight of 3.1%).5
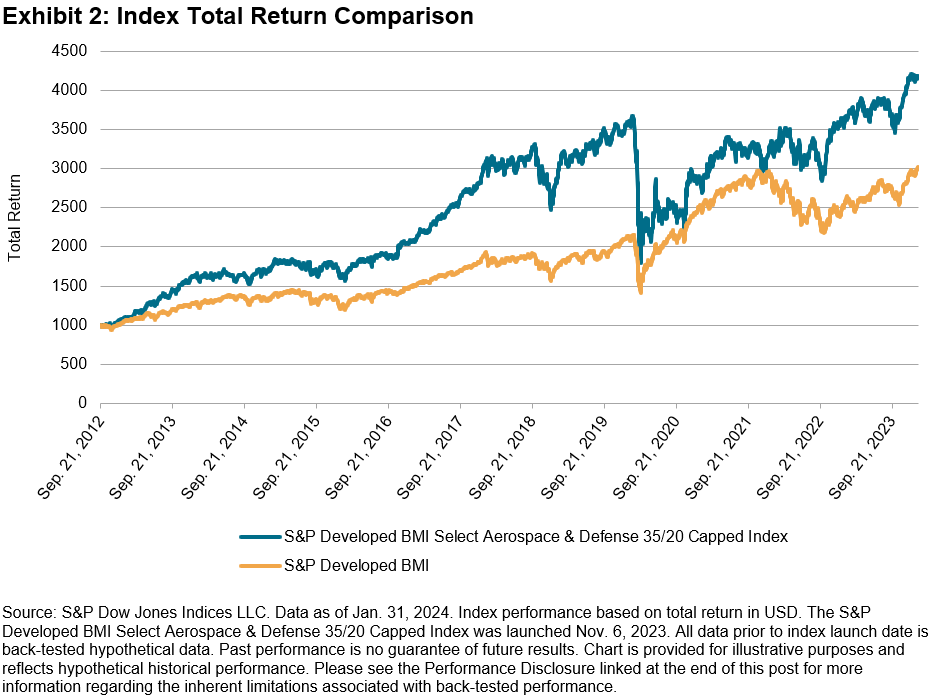
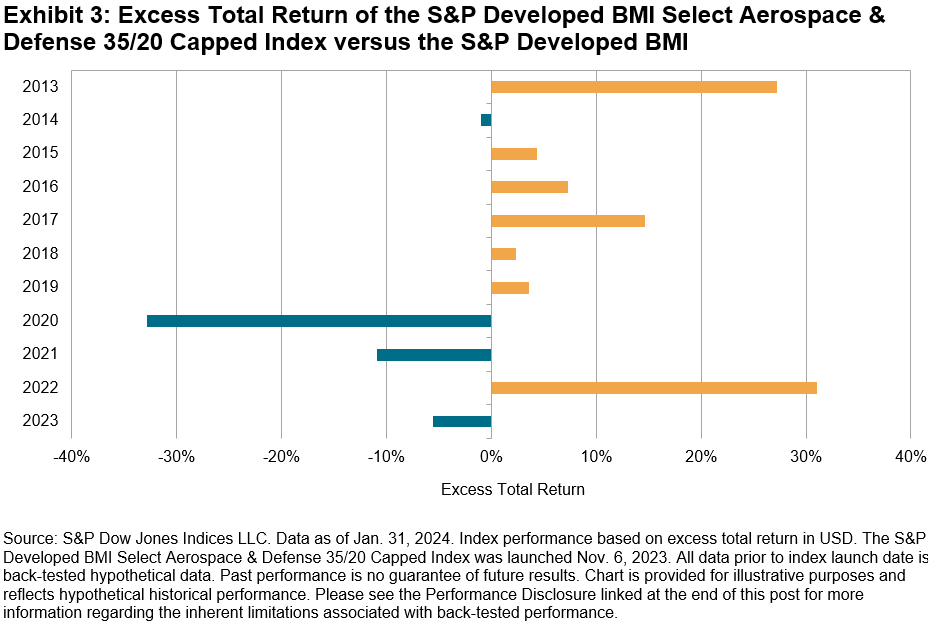
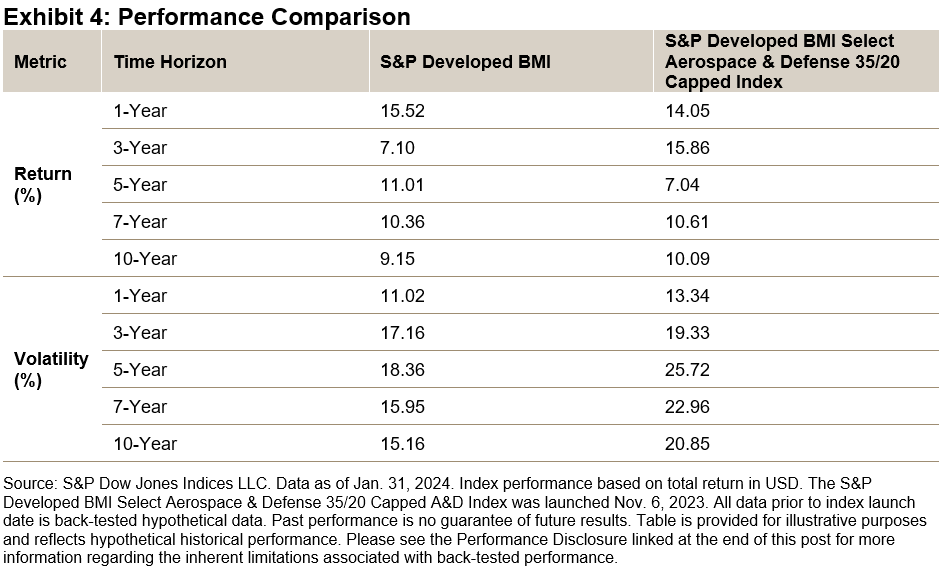
In terms of performance, the S&P Developed BMI Select Aerospace & Defense 35/20 Capped Index has outperformed its benchmark index across most analyzed time frames since 2012. Over the last three years, the index had an annualized return of 15.9%, compared to the benchmark’s 7.1% annualized return. Over the 10-year period, it also outperformed with a 10.1% annual return compared to the S&P Developed BMI’s 9.2%. However, it slightly underperformed the benchmark over the last 12 months, returning 14.1% versus the benchmark’s 15.5%. The index had slightly elevated levels of (annualized) risk over the 10-year period, around 20.9% compared to the benchmark’s parent’s 15.2%. Over the full back-tested period, the daily return correlation was around 79% with a constituent overlap of 1.5%.6
1Defense Spending “Cycles” Are An Illusion
2 Predictions for the aerospace manufacturing industry
3 2024 aerospace and defense industry outlook
4 Aerospace & Defense (A&D) Contractors
5 Constituent weights as of Jan. 31, 2024.
6 Index levels from Sept. 21, 2012, through Jan. 31, 2024.
Disclosure: Copyright © 2024 S&P Dow Jones Indices LLC, a division of S&P Global. All rights reserved. This material is reproduced with the prior written consent of S&P DJI. For more information on S&P DJI, please visit S&P Dow Jones Indices. For full terms of use and disclosures, please visit www.spdji.com/terms-of-use.
Editor’s Note: The summary bullets for this article were chosen by Seeking Alpha editors.


