Editor’s note: Seeking Alpha is proud to welcome Anthony Stella as a new contributor. It’s easy to become a Seeking Alpha contributor and earn money for your best investment ideas. Active contributors also get free access to SA Premium. Click here to find out more »
Sergei Dubrovskii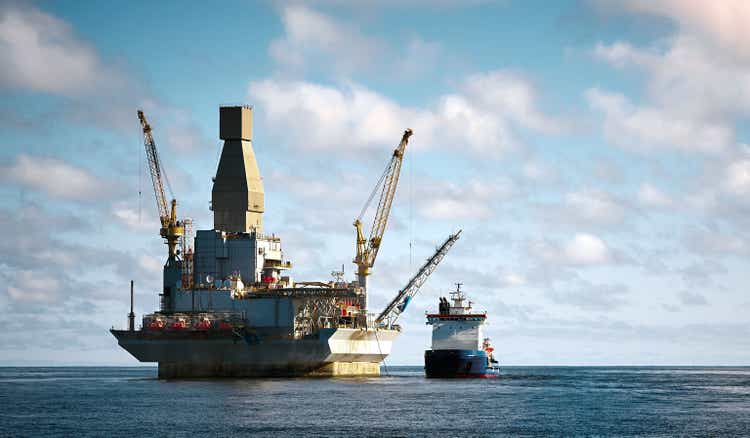
My Background
I am relatively new to the investing realm and graduated from Rutgers University in 2020 with a degree in Finance and IT. It was during my Junior year of college that I realized investing was my passion or, in other words, when I became conscious of the fact that I was reading Seeking Alpha articles and annual reports rather than going to class. Since then, I have gradually oriented my approach to finding businesses that are fundamentally undervalued, trying my best to see the world through the eyes of the proverbial “value investor.” This focus fortunately caused me to stumble upon the commodities space back in 2019. More recently, I sought to explore other opportunities within the energy sector that may thrive even in the face of a wide array of geopolitical outcomes, an environment of higher interest rates, and sticky inflation. This turned my attention to looking for large structural deficits that wouldn’t be easy to fix and hunt for the most likely beneficiaries.
With the aid of others’ research and my own personal efforts, I have identified several traits of Tidewater’s business that makes it stand out as a strong long-term investment. My purpose of this article is to share some of the factors that I consider to be most material to evaluating Tidewater’s present and future situation. In that regard, I want to help guide your thought process rather than try to convince you of any particular side of the story, although I believe it to be a compelling one.
Pillars of my Tidewater Investment Thesis:
- Tidewater has a competitive advantage in scale and fleet mix that will allow it to achieve substantial profits within a cyclical and fragmented industry, consisting of smaller and over-levered businesses.
- The company has acquired 50 PSVs well below replacement cost, which positions it to generate massive amount of FCF as the market turns.
- It has a re-vamped board of directors and high level of insider ownership, which should bode well for sound capital allocation decisions.
Company and Industry Overview
Tidewater is a leading provider of OSVs to the offshore energy industry, with global operations in all the major offshore markets. Its relatively young fleet currently has ~220 vessels and is primarily broken down into two main classes: 3/4 platform supply vessels (PSVs) and 1/4 anchor handling towing supply vessels (AHTS). PSVs transfer supplies and personnel to/from the offshore drillers (think RIG, VAL) while AHTS are primarily responsible for towing/anchoring mobile drilling units on water. As a general overview of the offshore industry, the offshore drilling companies own and operate the drilling equipment while offshore services companies support their operations. Offshore companies get paid through signing contracts with large oil majors like Chevron and Saudi Aramco rather than being in the business of selling the oil commodity itself. The day rate that is outlined in their financial statements is the building block of revenue and it refers to the revenue earned through a multi-month/year contract.
Tidewater is the currently the largest public company by fleet size in the offshore services space. With a ~$3.5 billion market cap and ~$650 million of debt, the company bolsters an enterprise value around $4 billion.
Now that you’re wildly excited, let’s explore some important characteristics of the industry and how Tidewater fits within that…
Industry Analysis
Strong Dependency on Offshore Spending
Barclays CEO Energy-Power Conference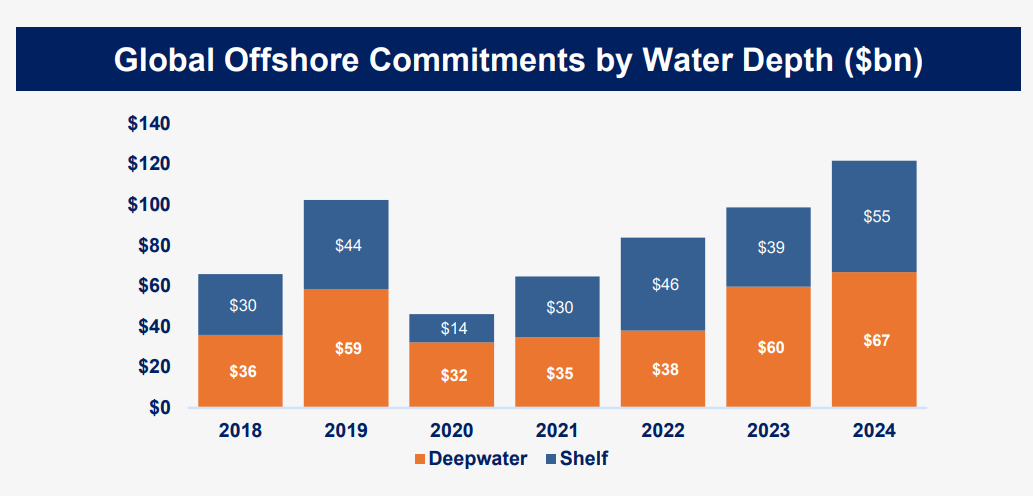
Management recently highlighted that capex spending in the offshore space is finally beginning to inflect upwards after enduring a decade-long downcycle. This is partly because the oil price has risen and also because the most economical onshore oil inventories are beginning to deplete.
The downward trend that began in 2014 likely would have begun inflecting upwards in 2019 but was extended due to the pandemic and coincided with negative sentiment that was equally extreme. As you can see, the VanEck Oil Services ETF (OIH) was left for dead and has only marginally recovered.
OIH – VanEck Oil Service ETF (marketChameleon)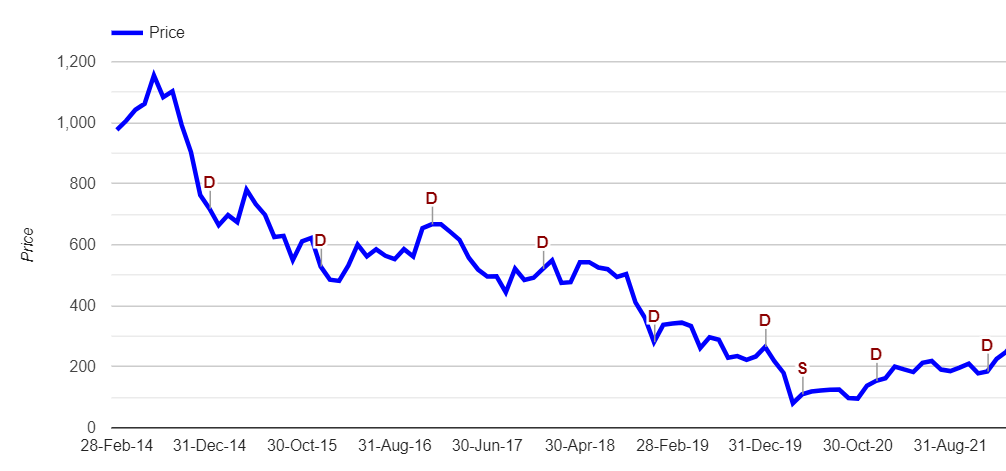
Total offshore spending over the last decade has been sluggish and many companies have had to sell assets to scrape by. The industry has also re-shuffled assets rather than built new vessels. Now that more assets are spread out globally and most of the remaining companies have greatly shrunk their fleets, much higher day rates will ultimately be needed to attract new investment in offshore.
Below is a slide from one of RIG’s investor presentations, which shows just how much leaner and less-diversified companies in the offshore space have become.
Transocean Investor Presentation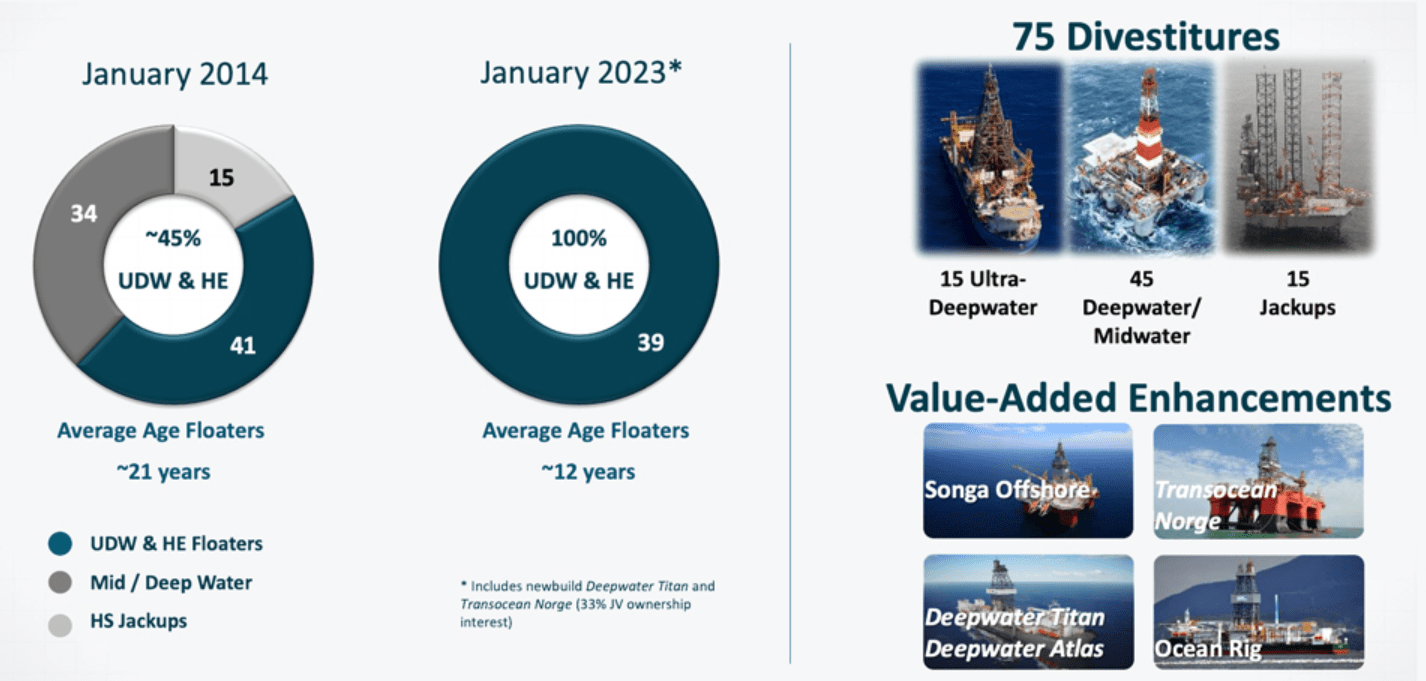
Additionally, most of the current offshore spending growth is for deepwater projects as compared to those in shallow waters (shelf). The vessel classes that seek to benefit the most from this trend are large PSVs and large AHTS, both of which Tidewater has heavy exposure to. Lastly, the majority (61%) of this offshore spending is from projects in Europe, South America, and the Middle East. Tidewater has large operations in all of these markets, as seen below.
Barclays CEO Energy-Power Conference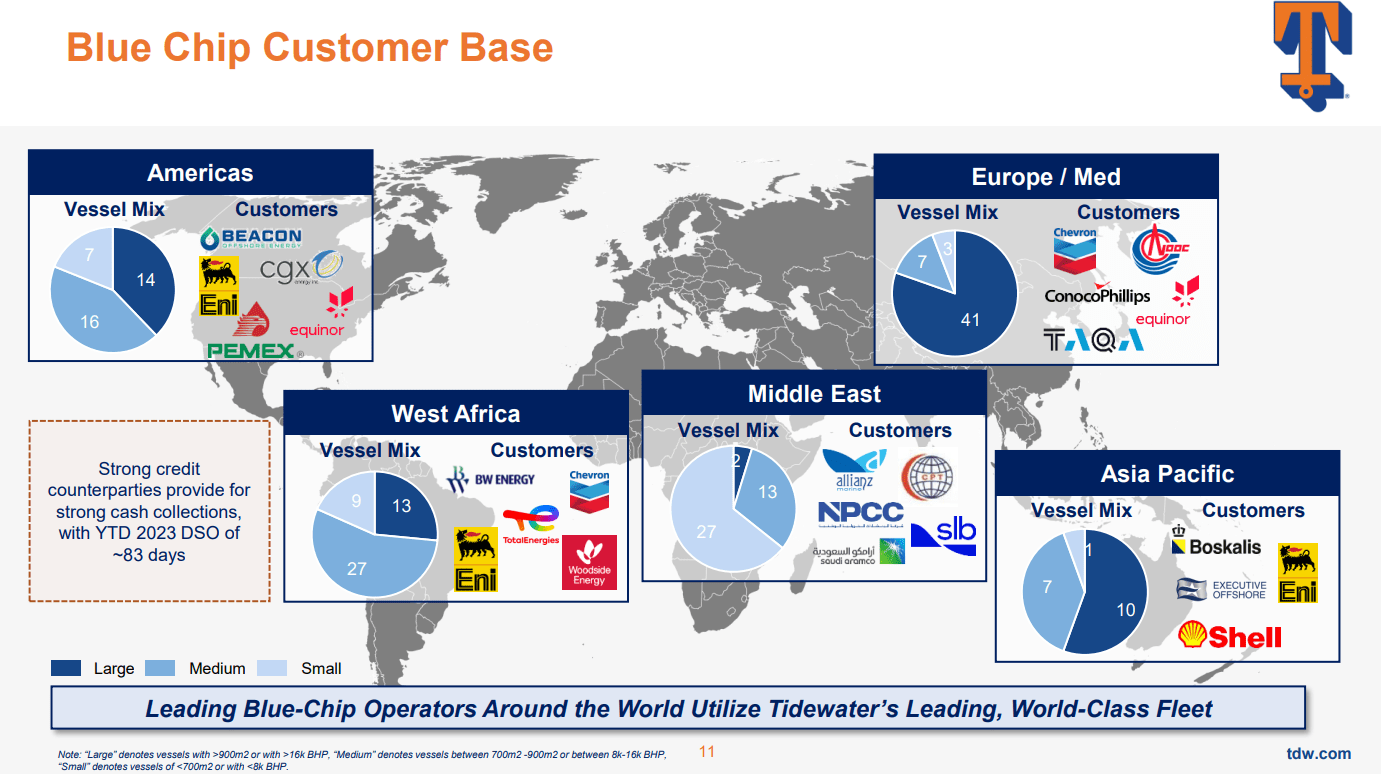
How We Got to Where We are Today
What most novice investors in this space often get wrong is thinking that offshore spending is perfectly correlated to the price of oil. While the volatile nature of oil gets a lot of headline attention, the offshore drilling business doesn’t respond immediately to swings in the spot price. Instead, contracts need to be negotiated between parties to ensure that an adequate return is received over the life of a multi-year project. Although oil has risen, the futures curve is still in backwardation, meaning that futures prices are lower than the spot price. I believe much more contracting will take place once the long-end of the curve eventually rises.
During the last decade, US energy investors have seen an investment landscape dominated by onshore shale. Political pressures and uncertainty about the future O&G environment persuaded capital allocators to favor shorter-cycle shale projects vs. longer, more costly offshore ones. A shale oil well costs $10m to drill and has a payback period of 3-6 months while offshore projects cost billions and take years to materialize into production. In this context, it’s pretty easy to see why “dirty” offshore drilling was the easy choice to cast aside.
Major shale discoveries led the US to became a huge net exporter of oil. We know that an individual shale oil well reaches peak production within a short time span, but the production path follows a steep decline as it matures, often described as the shale treadmill. Lots of incremental capital spending is required just to maintain that production level after the massive initial growth wears off. This economic reality has been delayed by productivity improvements but it is starting to take shape in most major basins. As the cost of capital rises and investors are realizing that shale production isn’t enough in the long run to meet growing global oil demand, the question remains – Where will this additional supply come from?
Primed for a Comeback
For businesses with a lot of operating leverage, prolonged down cycles can force an entire industry into bankruptcy. This is essentially what happened from 2014-2017 in the offshore services industry and in 2017, Tidewater filed for Ch.11 bankruptcy. What investors must be aware of is that it’s very difficult to rationalize costs in the short-to-medium term.
While it is true that an investor should prefer asset-light, cash-flowing businesses to capital-intensive ones all else being equal, there are moments in time in which investors completely overlook these industries, maybe because of their debt levels or because they were burned in the past. If industry dynamics stay favorable, Tidewater’s full earnings potential is not yet priced into the stock at its current price of $67.
A Changing Tide for Tidewater
In business terms, a fragmented industry is one in which there is a great deal of competition and little-to-no differentiation between the products or services offered. The offshore services space could be considered fragmented because most companies have similar fleets with minor differences in the age and size of their vessels. Tidewater is quite unique in that it is part of the top 1% of all operators in the offshore services space by fleet size, which gives it little competition in terms of scale heading into this next cycle.
Pareto Energy Securities Conference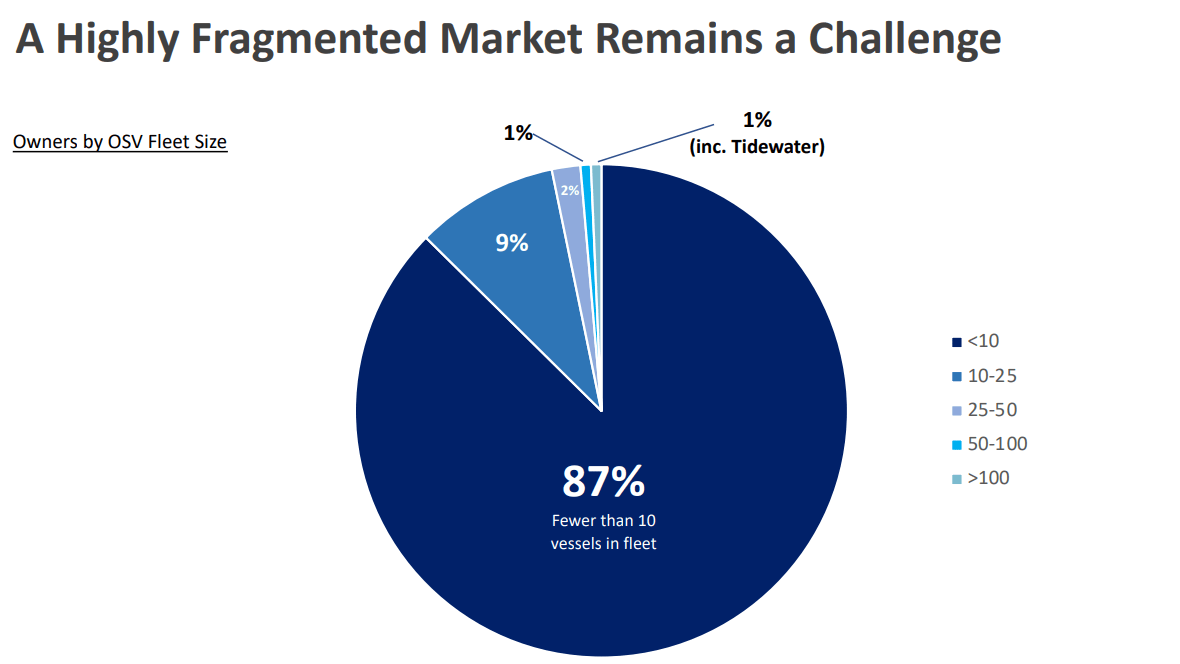
Moreover, Tidewater emerged from bankruptcy with a relatively low debt load. After two recent acquisitions, it was able to add significantly more large PSVs to its fleet than that of its nearest competitor. Tidewater is now the lead operator of large PSVs, with 70+ in its fleet. This is important because these types of vessels have demonstrated the highest utilization through all cycles and have barriers to entry (high costs and long-lead times) than smaller vessels. Most competitors don’t carry more than 10 of these larger vessels.
M&A Investor Presentation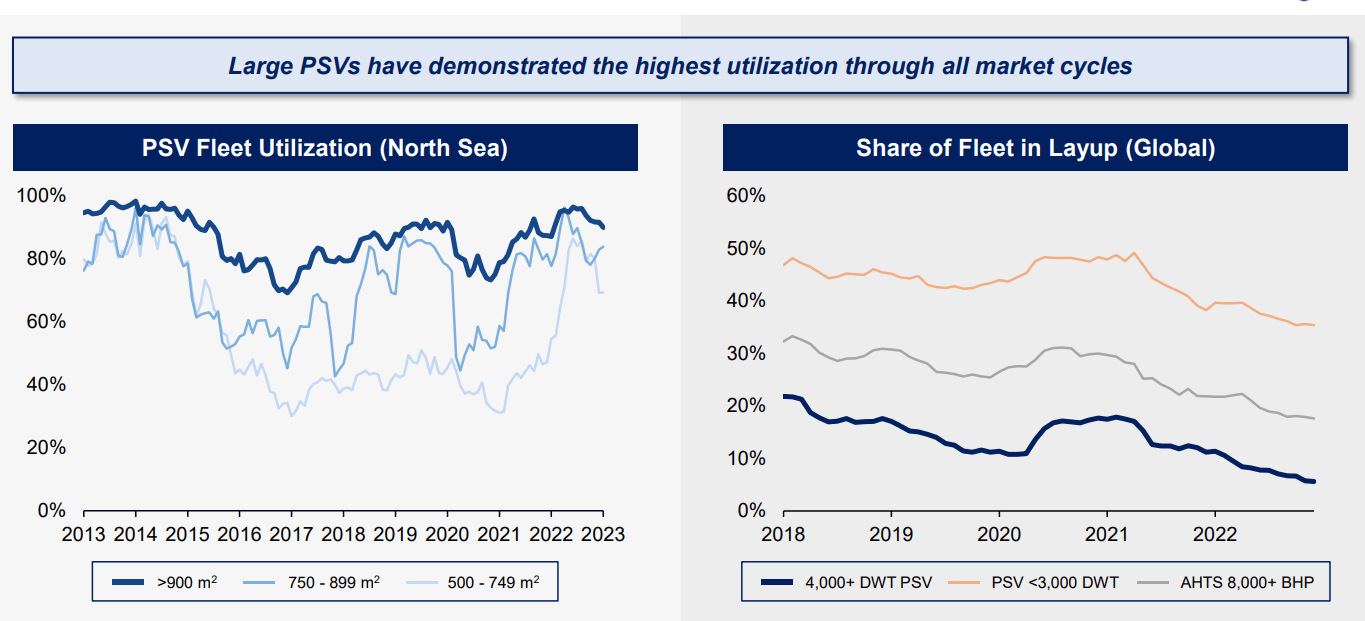
Taking you back to 2017, after Tidewater re-listed, incumbent management chose to pay down most of the debt that remained. The company retained its premium assets and shed some of its less profitable ones. By 2020, the company had less than $50 million in net debt against $800 million in tangible equity. Meanwhile, the vast majority of smaller operators didn’t have enough cash on their balance sheet or earn any cash flow to pay down principal on their debt. At best, companies were scrambling to push out maturities to buy time while lofty interest payments remained.
This environment created opportunities to acquire high-quality vessels from heavily indebted competitors and Tidewater’s management jumped on the opportunity to use its advantageous capital position. One of these transactions was the acquisition of 37 large PSV vessels from Solstad Offshore, who was looking to exit the O&G business. This was a very strategic move by Tidewater to sustain the company’s leading market position in large PSVs and it was able to acquire these high-spec vessels at 30-40% of what it would cost to build them today. The same type of playbook was executed to acquire the vessels of Swire Pacific, a struggling operator, below market value.
Not only will this drastically improve Tidewater’s return on tangible assets during the next cycle but also it has led to a consolidation of these large vessels. Given that Tidewater already had operations in all the major offshore markets globally, it’s recent acquisitions were additive to these markets and will allow it to unlock further economies of scale of higher geographic density, especially in the North Sea, where Tidewater’s large PSV market share increased from 13 to 31%. Once integrated, there are not many incremental costs because the higher concentration of vessels in a particular market let’s it utilize existing resources and labor. Vessel operating margins, which are essentially gross profits, are expected to rise from 38% to 50% this year. For context, SEACOR Marine Holdings (SMHI), a smaller competitor, has gross margins that are only 29% and are projected to increase to 40% which is 10% lower than Tidewater’s projections. These favorable unit economics will solidify the company’s competitive position and cost structure when the market turns.
Better yet, these acquired vessels are already operating actively under contracts, which has increased TDW’s total active utilization rate to ~80%. This provides immediate cash flow with substantial upside as maturing contracts roll onto higher market day rates. On this note, Tidewater’s industry does not operate on long-term contracts, unlike those signed by offshore drilling counterparts when a project is started. This is a big advantage for the services companies in a more volatile pricing environment. Contract lengths are much shorter (~7 months) compared to 2+ years for offshore drilling, and as a result, they can rolled over expiring contracts into higher rates, which is a natural advantage given how tight the market is.
In conclusion, with more cash up-front to deploy into acquisitions or return to shareholders in the form of buybacks/dividends, Tidewater maintains an advantage over competitors that will use excess cash flow to lower debt.
From Ch.11 to compelling opportunity?
When I think about the offshore services landscape, what comes to mind are those time-lapsed icicle videos we’ve all seen before. You will hardly notice a difference from day-to-day but over long periods of time, a beautiful crystal emerges. Similarly, investors are too often distracted by the hot narrative of the time and usually overlook these changes occurring beneath the surface in beaten down sectors because they materialize over longer time frames.
Just as an icicle crystalizes, Tidewater is beginning to take on a new form right beneath the surface…
Google images
New, Rationalized Fixed Cost Structure
The two largest fixed costs for Tidewater are D&A and G&A. From 2012 – 2014, the G&A cost for Tidewater averaged $780k per vessel. Today, that number is under $500k per vessel, which is indicative of how much the cost-side has been rationalized. One can expect this number to rise slightly in the coming quarters due to Tidewater’s recent acquisitions; however, the post-2017 restructuring emergence brought a change in management incentives, towards free cash flow and cost efficiency, which I expect will help keep the focus on maintaining a business structure that is G&A light. Management even commented on this saying, “The last two acquisitions saw our G&A expense spike in the first full quarter and we expect that this will be gradually worked down as we integrate them.”
As a whole, Tidewater is much leaner and the industry is much more consolidated than it was during the past cycle. This helps keep its overall cost structure lower as a % of its total earning potential when compared to that of its previous form and competitors. Previously, the company was holding onto a lot of legacy, older assets that significantly hurt its margins and cash flow. As a result, it was reinvesting at the time (2014-2016) into a large-scale newbuild program. This tied up a lot of capital just as day rates started their long descent.
Falling day rates (Barclays CEO Energy-Power Conference)
In the last two years, Tidewater added 60+ vessels to its fleet and is only carrying 6 stacked vessels at the moment. It wouldn’t be uncommon to see them carrying 20-50 stacked vessels during past cycles.
Source: Author’s calculations based on company data
| Worldwide Fleet Statistics | Q3 2023 | 2022 | 2021 | 2020 | 2012-2014 (AVG) |
| Total Utilization | 80.5% | 75.4% | 59.6% | 51.8% | 70% |
| Active Utilization | 82.1% | 82.8% | 80.1% | 77% | – |
| Average total vessels | 223 | 182 | 161 | 193 | 323 |
| Average stacked vessels | (4) | (16) | (42) | (63) | 60 |
| Average active vessels | 219 | 166 | 119 | 130 | 263 |
Total and active utilization have already risen past 80%. Total utilization refers to the % of vessels that are actively operating and it includes any stacked (inactive) vessels in the denominator. Considering that both active and total utilization are trending towards 80%, this bodes well for current cash flows, which largely shields the company from any immediate refinancing risk.
Its large weighting to large PSVs is giving it concentrated exposure to the fastest rebounding sector of the offshore services market.
Barclays CEO Energy-Power Conference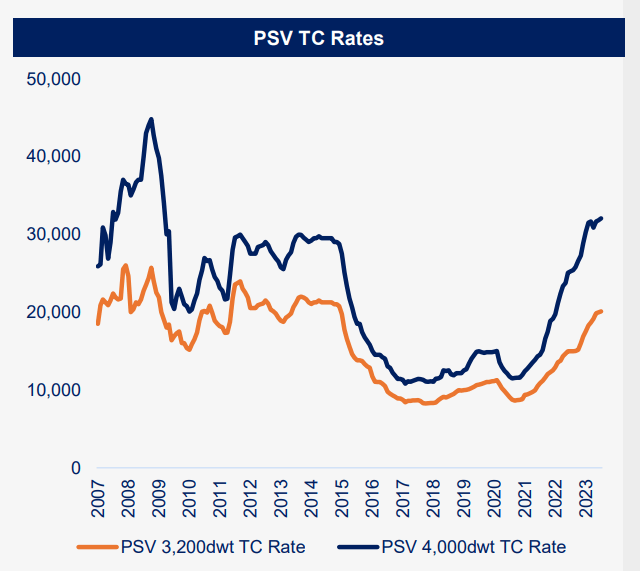
For comparison, SEACOR has a much smaller weighting toward large PSVs. As a result, its average day rates and margins have lagged those of Tidewater. Going back to the fixed cost discussion from earlier because SEACOR’s fleet size is much smaller than that of Tidewater, its G&A and D&A expense represents a higher % of total revenues. As per Q2 2023 results, here is the comparison:
Source: Author’s compilations
| Q2 comparison | Tidewater | SEACOR Marine |
|---|---|---|
| G&A / total revs (%) | 16% | 18% |
| D&A / total revs (%) | 18% | 25% |
This ensures that the companies like SEACOR cannot earn much profit unless day rates keep going higher.
Now, let’s look more closely at the promising state of the offshore services supply/demand scenario that can potentially keep day rates higher for longer and therefore, allow investors to truly reap the rewards of this company’s rationalized cost structure.
A Constrained Supply-side Situation
Based on current market dynamics, I see the supply situation in offshore services as being very sticky.
With vessel utilization rates trending back up into the 75-80% range, let’s first see if there is additional slack in the market that is likely to be brought online…
Clarksons Securities AS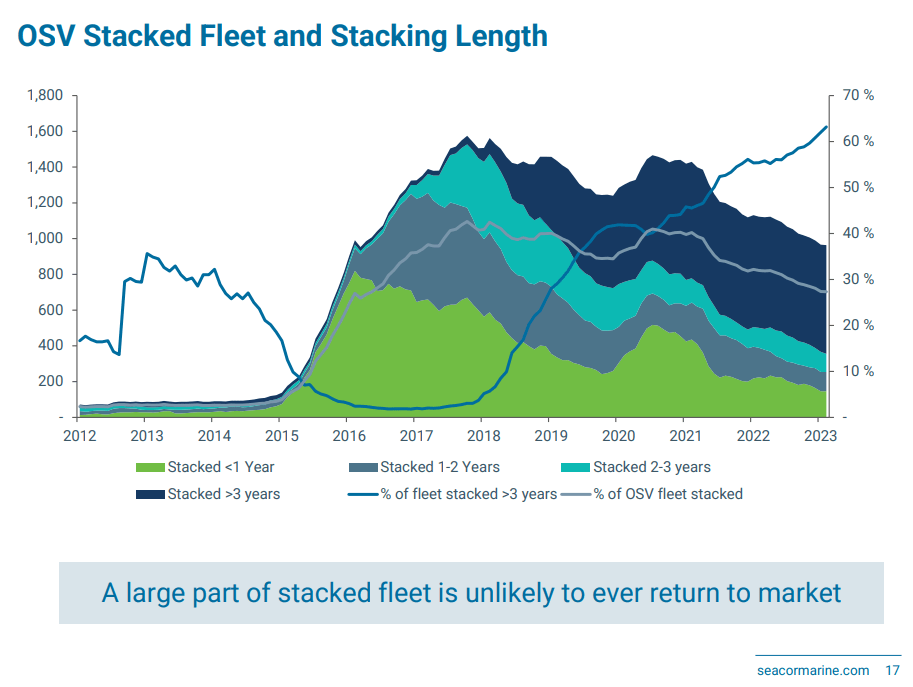
As seen above, there is a significant amount of OSV supply on the market that has been stacked/inactive for >3 years. On Slide 17 of SEACOR’s recent investor update presentation, management commented on this chart saying, “Vessels stacked for an extended time period are expected to require significant catch-up maintenance, special surveys and upgrades prior to re-entering the market.” These reactivation costs create another hurdle for their return to the market and a huge catalyst for day rates to rise enough until it incentivizes new supply. As a result, one can assume that there is not a great deal of slack capacity to re-enter the market, at least in the near team, which should keep new supply low until additional ships are built.
However, higher newbuild costs are creating yet another hurdle. It now costs around $65 million to build the same ship that was only $25 million to build five years ago. As a result of higher costs, is estimated that these ships would require day rates of $30k+ JUST to breakeven over a full 20-year depreciation cycle. In short, the current day rate picture is unlikely to incentivize investment.
…What about the orderbook for newbuilds?
Barclays CEO Energy-Power Conference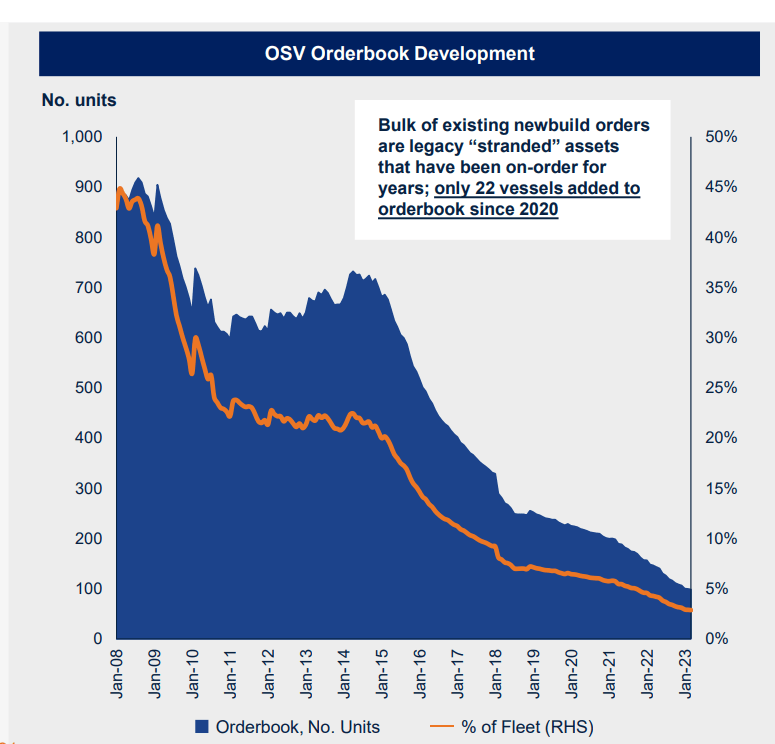
From my reading on the topic and insights from @CorneliaLake on Twitter, it appears that many of the newbuild ship yards overseas were liquidated or shut down. Of those remaining, a few are allocating their resources to building LNG vessels rather than offshore and are fully contracted out for 2024.
The other nail in the coffin is that during the prior cycle, offshore companies could start construction with as little as 10% down and finance the rest over time. Today, the shipyards are demanding as much as 40% upfront, which is troublesome for companies that are deprived on capital as it stands.
If offshore activity continues to pick up in a sustained manner, the offshore drillers may get more initial investor attention early on since these companies are already widely covered by the sell-side. Tidewater has very little coverage given that it is one of only a few public equities in a niche sub-sector of offshore services. However, I think investors will eventually migrate more to TDW as its strong business performance garners attention and investors realize the opportunity for longer-term compounding due to lower debt, greater consolidation, and less direct exposure to political risk.
In conclusion, the most important supply-side factors to consider for offshore services are:
- Higher newbuild costs which require significantly higher day rates (30k+/day) to justify new construction
- Breakeven costs are still higher than current day rates and interest rates have risen, which limits cash flow and the availability to grow
- A significant share (>60%) of the remaining stacked ships are unlikely to re-enter the market any time soon
Tidewater’s Newfound Moat
As we have already determined, the offshore industry provides investors with the opportunity for much higher profits during good times due to high weighing towards fixed costs.
As shown in the Peer Leverage Comparison Bar Graph below from a 2022 presentation, Tidewater has significantly less net debt as a % of total funded capital than the average offshore services competitor. It also has a market cap that is nearly triple that of the next largest company.
CapitalIQ and Company filings (2022)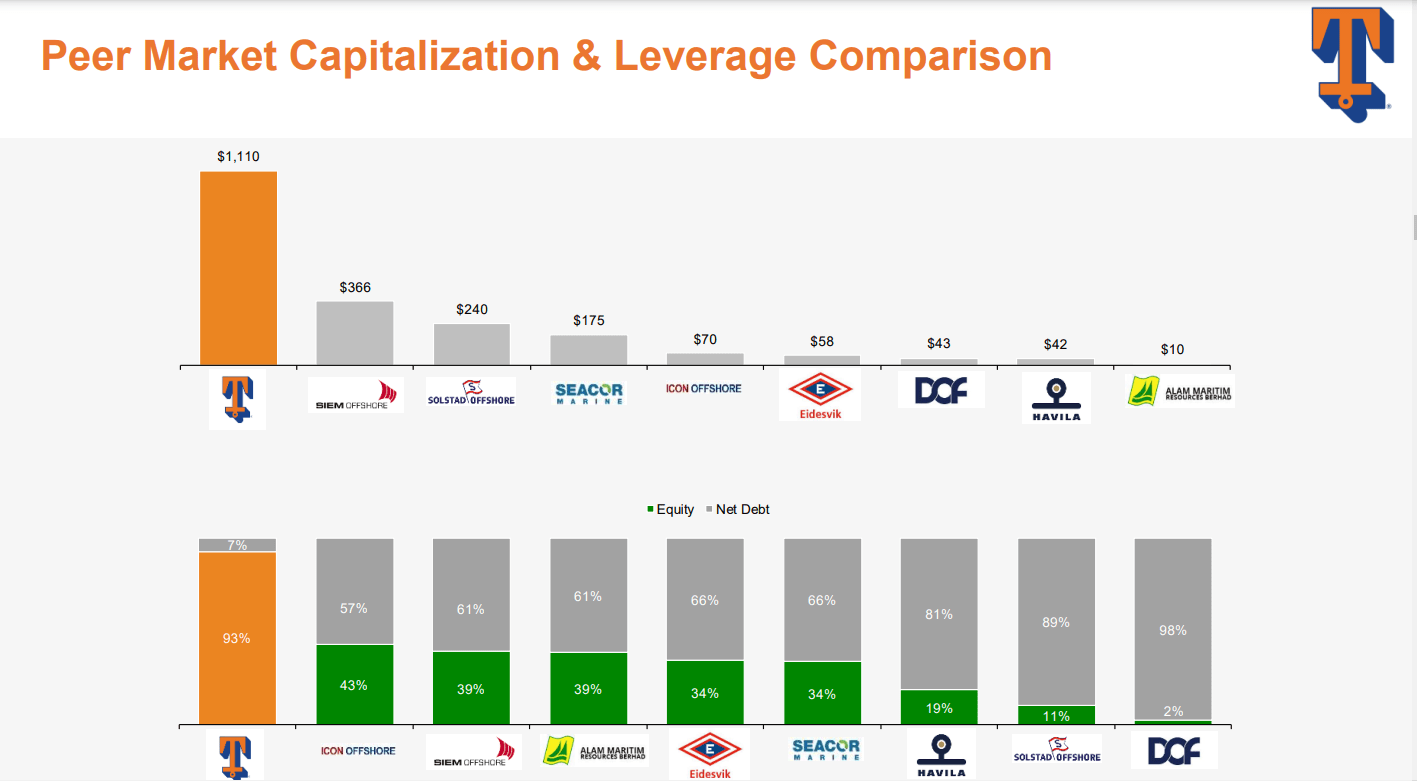
I see this large discrepancy between Tidewater and its competitors in a few ways. First off, Tidewater has more room to add debt to its balance sheet without being over levered.
Tidewater did add some leverage on its balance sheet to make acquisitions. At the same token, it has done so with minimal dilution to shareholders. The total leverage shouldn’t be of concern either; based on leading day rates, Tidewater’s 2024 free cash flow projection is higher than the entire debt load.
The market is discounting Tidewater’s moat in the form of its scale and cost structure because I believe it is currently fixated on the cyclical nature of the industry and not envisioning how the services market will play out over time given the new competitive landscape. Tidewater, in its new form, generates much more free cash flow at normalized day rates than it would have even a few years ago.
Also, even with a conservative capital structure, Tidewater had to borrow at 10%+. This is evidence of how little capital is available to the energy sector. Meanwhile, many its competitors need to first repair their balance sheets before even thinking about growing, outside of maybe a few such as Siem Offshore. Due to the large discrepancies in scale and capital structure, this seems like an industry ripe for further consolidation over the next decade. With modest leverage and sizeable scale, Tidewater will be able to continue to acquire smaller players if opportunities arise, which is highly accretive to its bottom line.
Big picture, the combination of rising capital costs and newbuild prices will make it difficult for any one player to expand supply without finding alternative methods to grow their fleet (i.e., acquisitions). Because Tidewater already has such a huge lead in its ownership of large PSVs, it is very difficult for another competitor to increase cash flow and ROI at the same rate. These factors create a significant barrier to entry for many participants in a fragmented industry and sets a naturally higher floor on day rates.
However, just because Tidewater is positioned well doesn’t necessarily equate to better shareholder returns. It is necessary to understand how management plans to allocate FCF, especially since there wasn’t clear shareholder alignment during the last cycle.
If you’ve followed the energy space as a whole for the last 3 years, many companies have extended debt maturities further out and are now returning capital to shareholders with higher commodity prices.
Here are some comments from Tidewater’s Q2 earnings call that highlights how management is thinking about capital allocation moving forward:
– “As it relates to capital allocation, our first allocation would be to accretive value acquisitions, similar to the last 3 that we’ve done, that support our existing global position in large PSVs and other OSVs that are somewhat less commoditized, like the large anchor handlers. Absent value-accretive M&A, we would seek the best ways to return money to shareholders. Frankly, we’re making more money on our cash than we have in recent memory, but I’m still not looking to hold on to the cash and the associated negative carry. Our current secured bond precludes any returns of capital until November 17 of 2023, about 3 months from now. Also, any returns of capital would need to be measured until we have a debt capital structure that is appropriate for a cyclical business. To me, that is a combination of long-dated staggered maturity and secured bond debt and an ample revolver, our recent unsecured financing is a step in that direction.”
Of course, the unsecured financing that was mentioned refers to the $575m in unsecured bonds issues to finance the purchase the 37 Solstad vessels. TDW’s debt also had covenants which prevented any capital returns until November 2023. Now that this barrier is lifted, buybacks may be another catalyst for the stock.
Something that flew more under the radar was that Tidewater recently received another ~$100 million capital infusion from equity warrants that expired in the money. This provides the company with additional capital without diluting shareholders materially (added around 2 million shares or 4% of total shares outstanding).
If average day rates for the entire fleet were to hold at $18k/day, Tidewater’s cash flow from operations (CFO) would come in closer to $450m for 2024, which seems conservative given that management commented on leading-edge contracts in Q3 saying, “During the quarter, we executed 27 term contracts with an average rate of approximately $28,600 per day with the new contract distribution essentially in line with our vessel distribution.” These contracts are likely for large PSVs and considering its heavy weighting to this type of vessel, Tidewater would generate closer to $1 billion in cash flow from operations in an upside case.
The good news is that heading into this cycle, the board of directors own 6% of the company and management incentives are tied to FCF. This influx of cash is exactly what the company needs to prove to investors that it will live up to it word. After the debt is structured according to management’s wishes and a revolver is secured, it would not be hard to imagine a scenario in which dividend/share repurchases are on the horizon. Below is the current debt maturity profile.
Barclays CEO Energy-Power Conference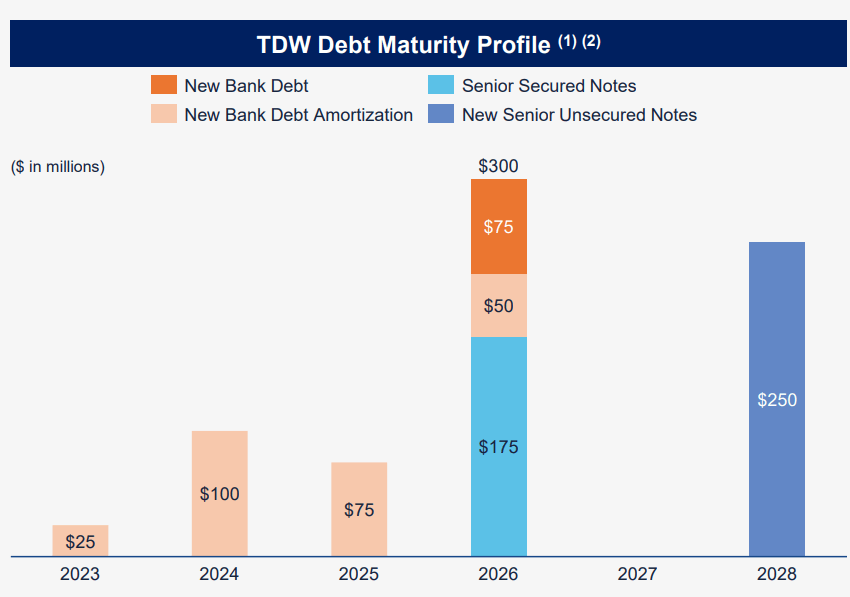
Recent Performance, Valuation Considerations, and Risks
In the beginning of 2023, management recently commented on day rate trajectories in the Mediterranean and West Africa, noting that leading-edge day rates for their larger class of vessels has reached in excess of $30k. This is a far cry from the $15k rates back in 2021.
TDW presentation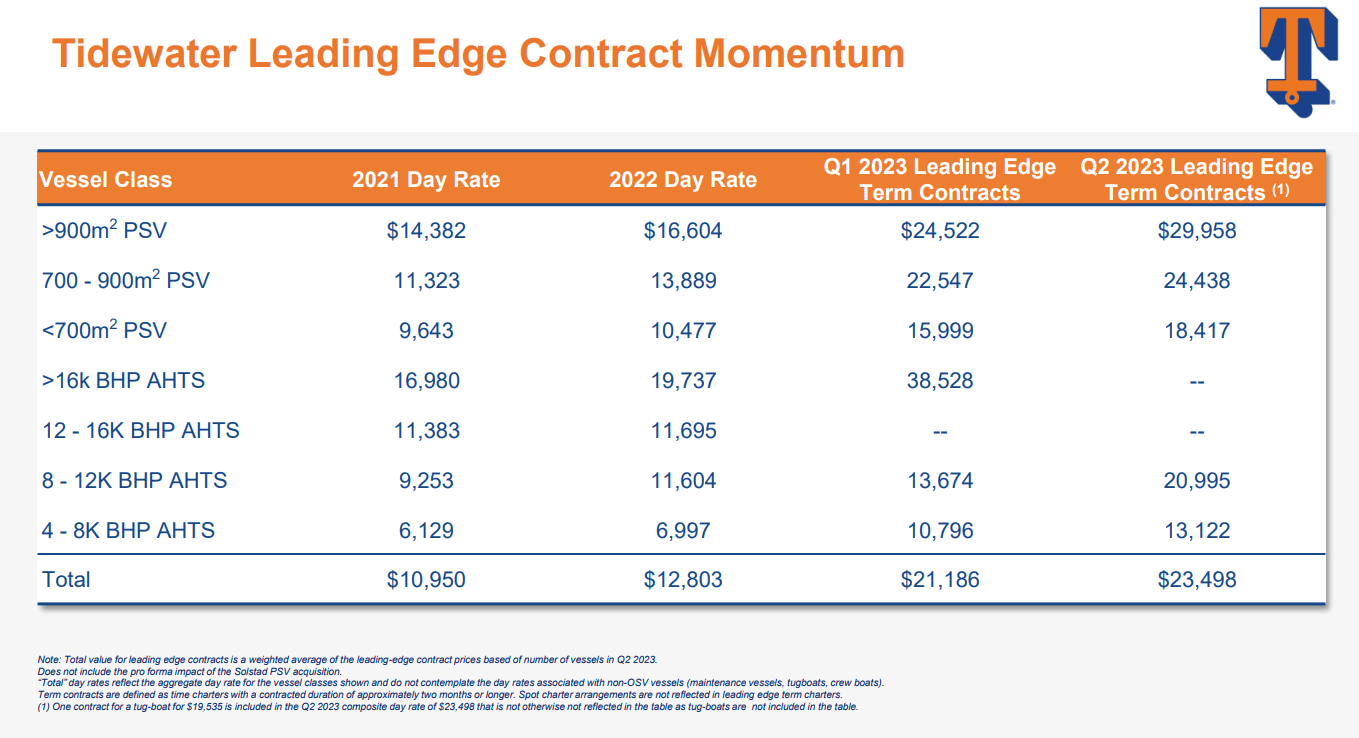
If we put this into perspective and assume that all 75 of Tidewater’s large vessels (>900m2 PSV) can achieve $25k/day contracts in the foreseeable future, this subset of vessels would fetch annual revenues close to $600 million.
If this were the case, this subset of large vessels (1/3 of total fleet) would be generating the same revenues as the entire 200 ship Tidewater fleet earned just a year ago in 2022…
I can see how one might be hesitant to invest after such a big run-up in the stock price and this is very understandable from a market psychology perspective. However, the business fundamentals continue to improve for the company given the trajectory of day rates.
YCharts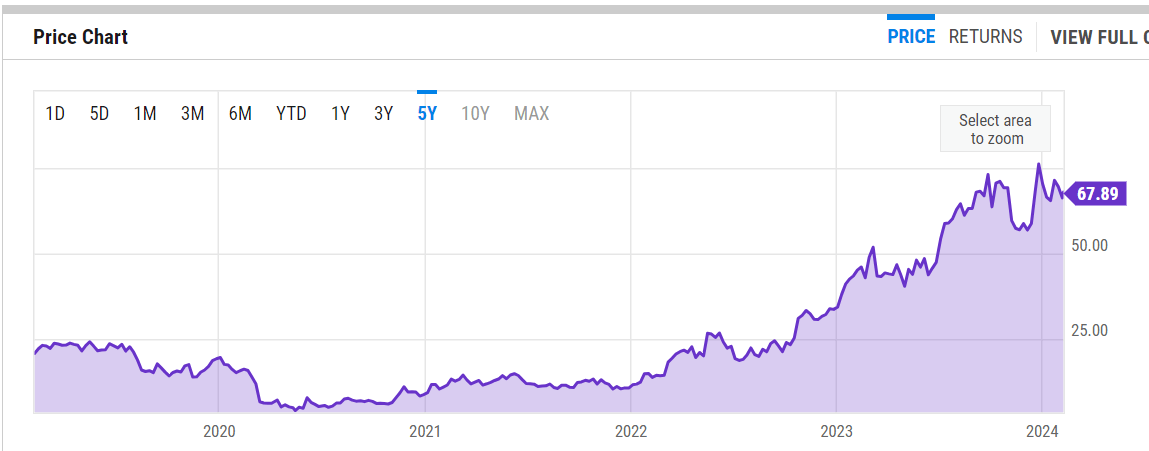
Peer Comparison
It is important to look across the entire industry to see how rising day rates and utilization over the past few quarters have impacted the numbers of Tidewater’s competitors as well.
While true that the rising tide is lifting all boats from a top-line standpoint, the debt service cost will be a real crutch for smaller, levered companies and has essentially consumed the majority of any operating income they’ve generated. The story may be different in a few years if day rates continue to rise from here, unabated. However, if rates level off soon, these companies will struggle to reduce their total nominal debt load and therefore, the higher interest expense will remain. To illustrate how this is materializing, I have incorporated a snapshot below from SEACOR’s Q2 report (average day rate around $16k).
Seacor Marine 2Q 2023 Earnings Release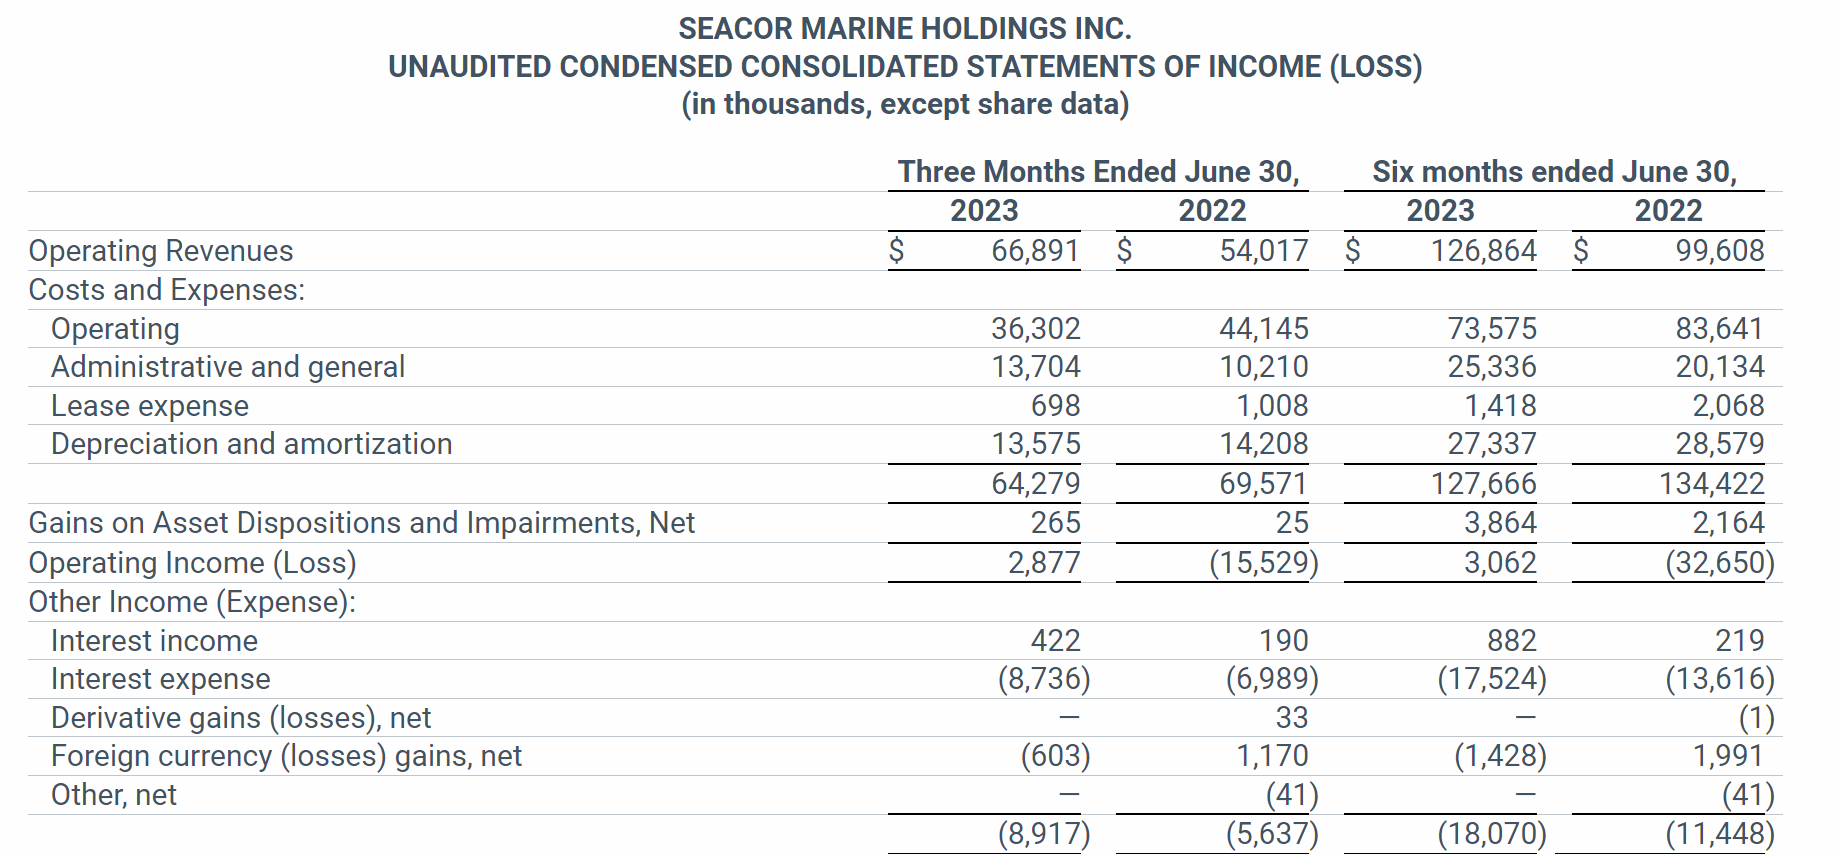
SEACOR has done a good job at managing operating costs in the near-term but this is most a function of lower drydocking expenses, which will invariably rise and fall over time. Tidewater comments on this drydocking expense in Slide 26, in regards to why it fluctuates year-to-year. This “drydocking” amortization expense essentially annualizes a required maintenance expense that offshore companies must make once every five years for each vessel. This expense fluctuates as a result of a few things: staggered newbuild dates that have taken place over the course of the company, acquisitions of vessels of different ages, and stacking and re-activation of vessels.
Once you account for debt service costs and smooth out the drydocking expense, you notice that companies like SEACOR need in excess of $20k day rates over a sustained period of time to generate any cash flow. And SEACOR has 59 vessels in its fleet. Given that 98% of the industry’s companies have fewer than 50, we can assume that until rates get above this level, there will be minimal-to-no new investment in the industry. This essentially serves as a rough estimate for the full cycle breakeven for the current fleet in the industry, in the current state of debt-to-equity levels.
Sell-Side Estimates are Still Lagging
Barclays CEO Energy-Power Conference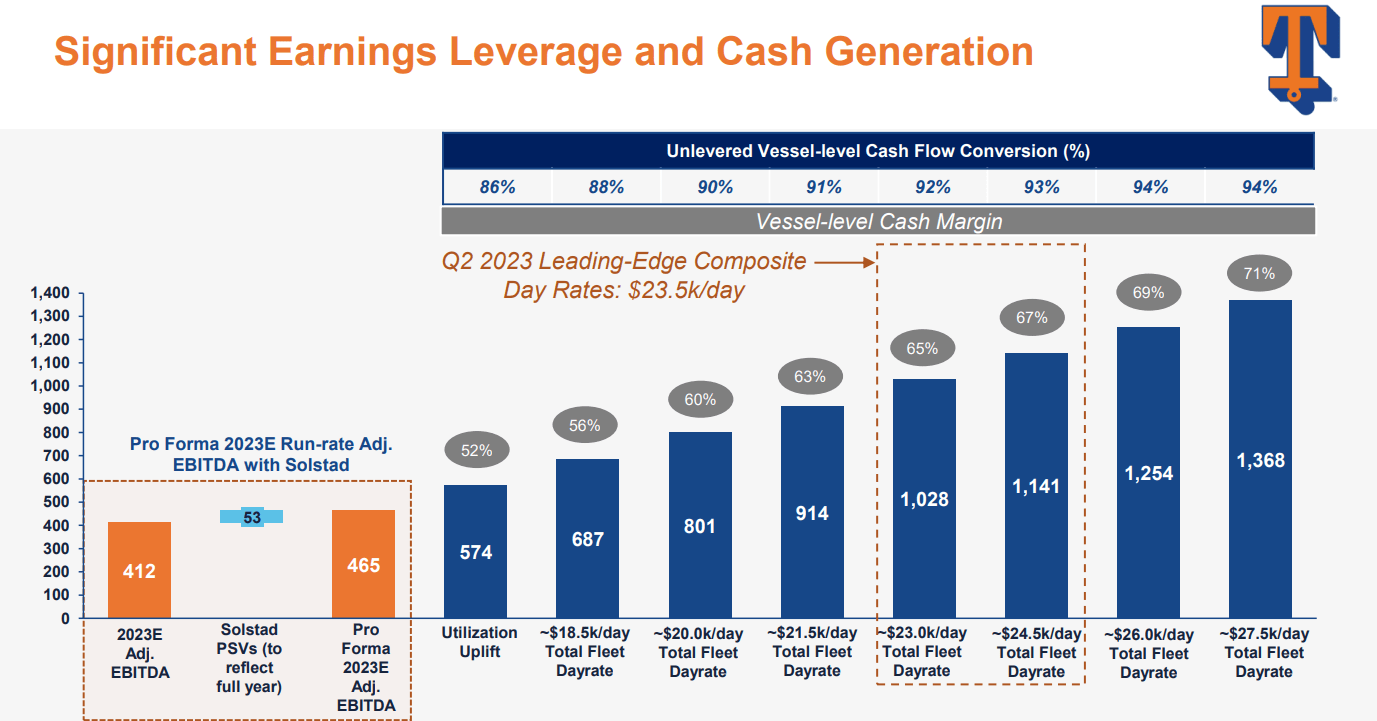
Doing some deep digging back to 2022, we can see just how much this range of projections has shifted in short notice.
Pareto Securities Conference
Average day rates for leading-edge contracts have already risen to $23k/day for TDW’s entire fleet.
What’s interesting to note above is that Tidewater will generate roughly $1 billion in EBITDA at these day rates.
Meanwhile, as of Q2 2023, sell-side consensus estimates for EBITDA have yet to catch up:
2023 = $318mm
2024 = $366mm
2025 = $444mm
Tidewater’s Return on Capital / Cost of Growth
Now, let’s consider how we can use our understanding of Tidewater’s business to estimate what it may be worth.
As an example, imagine that you assume day rates are likely to average $23k/day next year, based on market dynamics, and will rise with the rate of inflation each year for the next 10-years. At 23k day rates, against a diluted share count of 54k, Tidewater would earn somewhere around $12/share. This represents “owners earnings” or FCF available to shareholders. It’s after-tax return on tangible assets would be around 35% against an equity book value of $1b. However, it is important to note that this is based on asset book values that were either impaired or written-down and assets from acquisitions that were made well below fair market value. Therefore, this number serves to only give an investor an idea of what return he/she can expect on capital investments that were made in the past.
There is no reason to assume that this ROA will be consistent each year for a cyclical business. However, based on the industry dynamics I outlined previously, let’s assume that the average day rate rises 5% each for the next 10 years. Under this assumption, in 10 years, Tidewater would earn $19/share. If we subtract these earnings numbers, Tidewater will have grown EPS by $7 over this decade. Using a more conservative long-run return on tangible assets of 20%, given that newbuild costs are rising / Tidewater may not have the same favorable acquisition prospects in the future, we can estimate how many earnings Tidewater will need to retain over a ten-year period to at least maintain its growth rate and competitive position. By dividing $7/20%, it is estimated that it will need to retain $35/share. Meanwhile, the cumulative earnings over this time frame are ~$155/share.
Therefore, $120/share could be paid out to shareholders, or around $10/share annually.
I believe these assumptions are reasonable given that the company is positioned well to throw off excess cash flow with minimal current needs for growth capital investments due to its (1) young fleet (2) much greater size / market share relative to peers
If this holds true, at today’s current stock price of $65/share, investors are being offered a nearly 15% annualized return. Put otherwise, Tidewater could buy back its entire float in roughly 6 years at $23k day rates and 80-90% utilization.
Other Valuation Considerations
As you’ve heard before, valuation is both an art and a science and an investor can use various metrics to aid in their valuation calculation for Tidewater: recent appraisals/asset sales, cash flows under normalized environment (80% utilization), and growth expectations based on reinvestment rates and return on capital.
Recent appraisals- In a 2022 investor presentation, on slide 11, Tidewater calculates the estimated appraisal value of its fleet at $1.7b (against an implied enterprise value of $4b). It is also important to note that this appraisal value was calculated using data from 2022 and within the past few quarters, Tidewater’s blended day rates have risen from $13k to roughly $18k/day.
Because Tidewater operates in a cyclical industry, its earnings do not follow a simple trend line, but rather fluctuate meaningfully from year-to-year. Therefore, focusing on cash flow from operations and maintenance capex costs are better indicators of core business performance.
Normalized cash flows- For a capex heavy business like Tidewater’s, an investor should look at [FCF = cash flow from operations – maintenance capex]. Maintenance capex refers to the minimal amount of capital spending that is needed to sustain the previous year’s level of cash flowing through the business.
The maintenance capex costs come in the form of D&A and deferred drydocking cost for offshore service vessels. Tidewater mentions that the average drydocking cost is $1.5 million per vessel and must be incurred every five years for each ship. For Tidewater’s entire fleet, this cost comes out to ~$300 million every five years or $60 million per year. So adding this amortized drydocking expense ($60 million) to its current fleet depreciation ($115 million) brings its total annual D&A to around $175 million.
Taking this a step further, we should try to bridge the gap between D&A (based on past spending) and today’s true capex costs to see what the true current capex costs are just to maintain its fleet capacity over time. When looking at maintenance capex needs for Tidewater’s large PSVs, we can use current information provided by the company:
- Number of deadweight tons (carrying capacity) of a large PSV = ~ 5,000 dwt
- Useful life of vessel: 20 years
So if a typical new large PSV has a useful life of 20 years and 4,500 dwt, then we multiply 1/20 * 4,500 = 225 dwt. Therefore, maintenance capex needs for Tidewater refer to the cost of replacing 225 dwt/year. Given that newbuild costs are estimated to be $65 million, we can use assumptions of a 7.5% salvage value (65 * .925 = $60m) and 4,500 dwt pet large vessel, to arrive at a cost of $13,333 to replace a dwt. Multiplying $13,333 by 225 dwt/year gives us the economic depreciation on a large PSV, which is $3 million/year. Essentially, this tells us the following: assuming TDW want to maintain its fleet capacity over time through building new ships, each ship must generate in excess of $3 million/year in annual real cash flow to actually provide an investor with any positive FCF. Now again this is just an approximation but ultimately helps us calculate the total annual newbuild replacement for Tidewater’s fleet.
Given that Tidewater has 70 large PSVs, this annual maintenance capex comes out to roughly $210 million at today’s newbuild prices. This maintenance capex calculation only applies to 1/3 of Tidewater’s total fleet, which means that the company’s total annual D&A of $175 million for its entire fleet will likely grow over a long time frame, especially if organic capital investments are pursued at higher costs.
Risks
As with any investment, there are always risks to the thesis you outline. Although I believe that the favorable industry dynamics far outweigh the risks, there is no guarantee that offshore drilling demand will pick up in a sustained manner, which would negatively impact the services businesses as well. Geopolitical factors and government regulation could significantly hurt Tidewater’s potential to make further acquisitions and/or dampen its favorable cost structure that I previously mentioned.
Also, while rising capital costs may impact Tidewater’s competitors more than itself, there is no guarantee that the company will be able to access the capital markets at attractive rates moving forward. Without high enough day rates for a sustained period, this will make it difficult for any company in the industry to generate meaningful cash flow, which is important considering that it will likely cost significantly more in the future to build new vessels. Because Tidewater relies on the resiliency in day rates from its large PSV vessels even more than its competition, there is no guarantee that it will be able to outperform if day rates for this vessel class falls back to previous levels.
If you would like to read through the risks that Tidewater outlines in its own annual reports, you can find them under the “Risk Factors” section here.
Conclusion
If we were to annualize $23k/day rates, Tidewater’s EBITDA would fall somewhere in the range of $1 billion, up against a current market cap of $3.5 billion. Based on next year’s guidance, the company is trading at a forward EV/Sales of 2-2.5x. For comparison, Tidewater traded at an average EV/Sales multiple of ~4x during the last bull market. Tidewater’s margins are stronger than the last cycle and the company is much more conservatively capitalized.
I also believe that a high ROE can be maintained for the foreseeable future given that Tidewater can materially reduce its share count each year if it chooses to do so. Even accounting for the occasional acquisition, Tidewater can generate a very favorable return on assets and equity given that it has a young fleet. It is also estimated than the company’s modern fleet can operate for decades and potentially outlive the current straight-line depreciation schedule, which would be an added boost for long-run, compounded returns.
For all of these reasons, I believe Tidewater to be a very attractive investment and see potential upside in its share price to around $125-150/share, with the bonus of capital returns, over the next decade.

 Q2 2024 Earnings Call Transcript")

