Isogawyi/Moment via Getty Images
Investment Thesis
The success of the Invesco S&P MidCap Momentum ETF (NYSEARCA:XMMO) since its Index change on June 21, 2019, strongly indicates the momentum factor has value when applied to S&P MidCap 400 Index stocks. However, it’s essential to understand things were once rocky for this ETF, which is up 17.41% YTD, 14.83% more than the SPDR Portfolio S&P 400 Mid Cap ETF (SPMD). Recent outperformance is driven by only one stock, and in this article, I will calculate the relevant performance statistics against its S&P MidCap 400 Index benchmark and 33 mid-cap ETFs. In addition, I’ll evaluate XMMO fundamentally and consider how well it scores on other critical factors like growth, value, and quality. I hope you enjoy the read.
XMMO Overview
Strategy Discussion
Since June 21, 2019, XXMO has tracked the S&P MidCap 400 Momentum Index after previously tracking three different Indexes, as follows:
- Dynamic Mid Cap Growth Intellidex Index (Inception To June 16, 2011)
- RAFI Fundamental Mid Growth Index (June 16, 2011 To May 22, 2015)
- Russell Midcap Pure Growth Index (May 22, 2015 To June 21, 2019)
For this reason, long-term performance statistics are not relevant. The S&P MidCap 400 Momentum Index uses a twelve-month measurement period, with winsorized momentum scores calculated for all members, which, according to the methodology document, “reduces the impact of outliers on a data set” and is a widely accepted method of standardizing a variable. Stocks are weighted based on the product of their momentum score and market capitalization at each semi-annual rebalancing in March and September. This weighting scheme gives a nod to quality, as larger companies are typically more profitable.
XMMO has a 0.34% expense ratio and $1.57 billion in assets under management as of February 16, 2024. Finally, readers should know that XMMO’s strategy is effectively style-agnostic. There are no consistent sector exposures or expected earnings growth rates, and its P/E can fluctuate substantially based on what sectors have performed well over the last measurement period.
Sector Exposures and Top Ten Holdings
XMMO’s sector exposures are listed below. As comparators, I’ve included SPMD and three other S&P MidCap 400 style ETFs:
- The SPDR S&P 400 Mid Cap Value ETF (MDYV).
- The SPDR S&P 400 Mid Cap Growth ETF (MDYG).
- The Invesco S&P MidCap 400 GARP ETF (GRPM)
Morningstar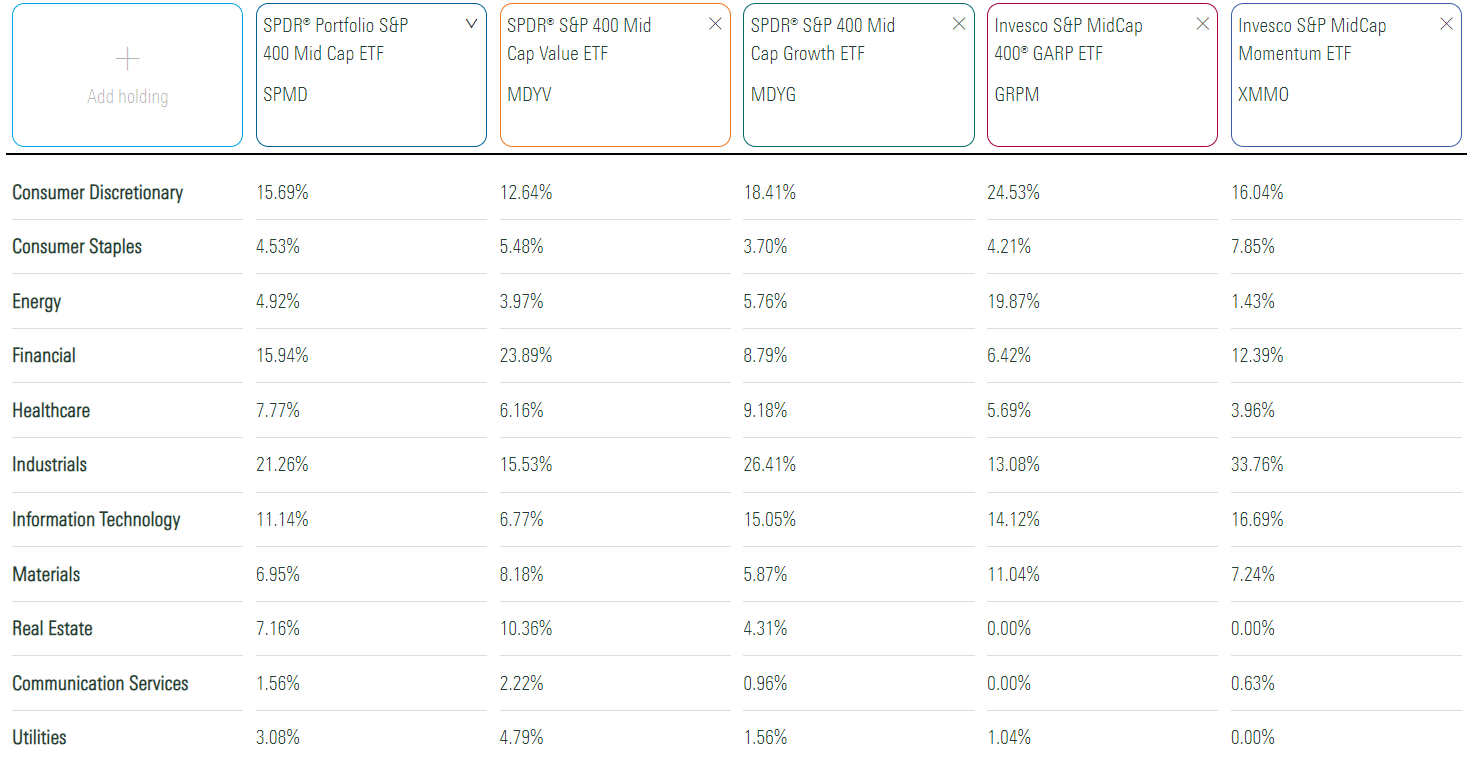
XMMO is currently overweight Industrials (33.76%) and Technology (16.69%), which is most consistent with MDYG and reflects how well growth stocks have performed recently. There is no allocation to Real Estate because the sector’s one-year return is -7.99% through January 31, 2024. Meanwhile, the S&P MidCap 400 Industrials Capped Industrials Index is up 17.80%.
S&P Dow Jones Indices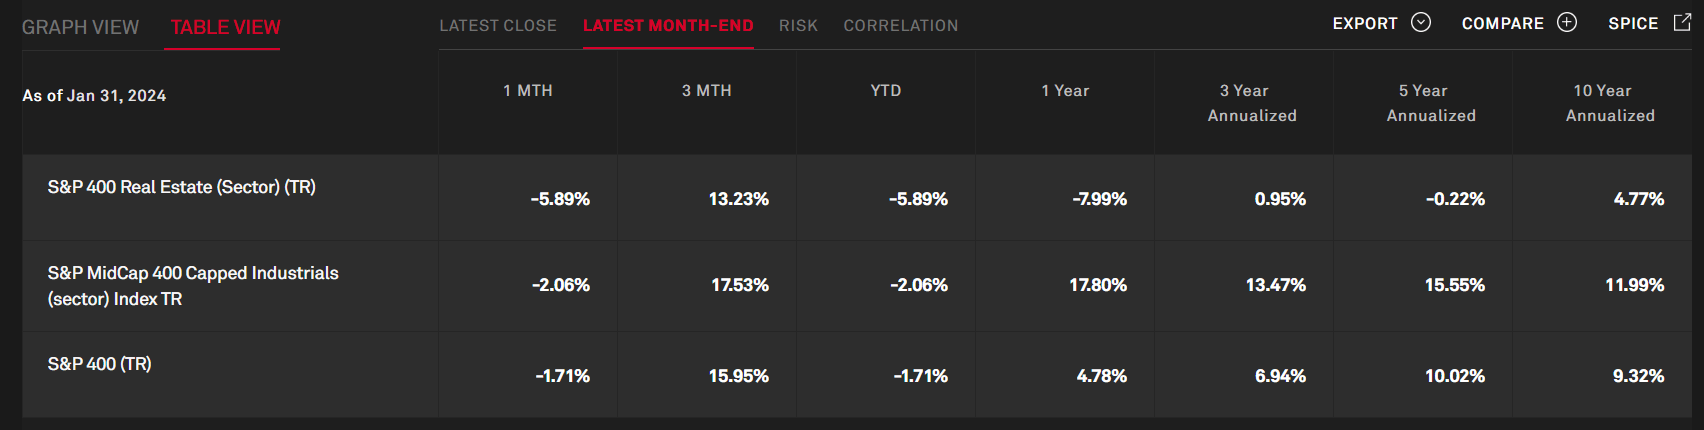
XMMO’s top ten holdings are below, totaling 36.23% of the portfolio. Usually, it’s not this concentrated, but Super Micro Computer (SMCI) is up 182% YTD, even after declining by 20% on Friday. It will likely graduate to the S&P 500 Index shortly, and I want to emphasize that this stock is responsible for most of XMMO’s recent gains.
Invesco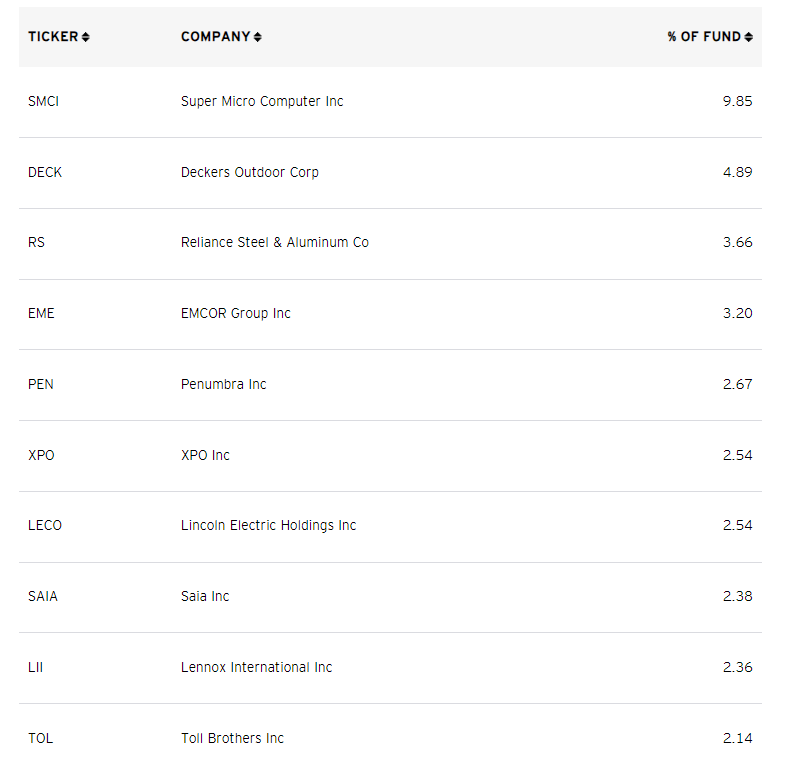
XMMO Performance Analysis
Since July 2019, the first month after its Index change, XMMO has delivered an annualized 13.66% gain, outperforming SPMD by 3.58% per year with less volatility. These statistics are encouraging, but it’s evident the momentum factor only sometimes outperformed. XMMO outperformed by 15% in 2020, but then lagged by 8% and 3% in 2021 and 2022. Coincidentally, XMMO and SPMD had identical returns up to December 2022, as indicated by their $13,197 balances on an initial $10,000 investment in July 2019.
Portfolio Visualizer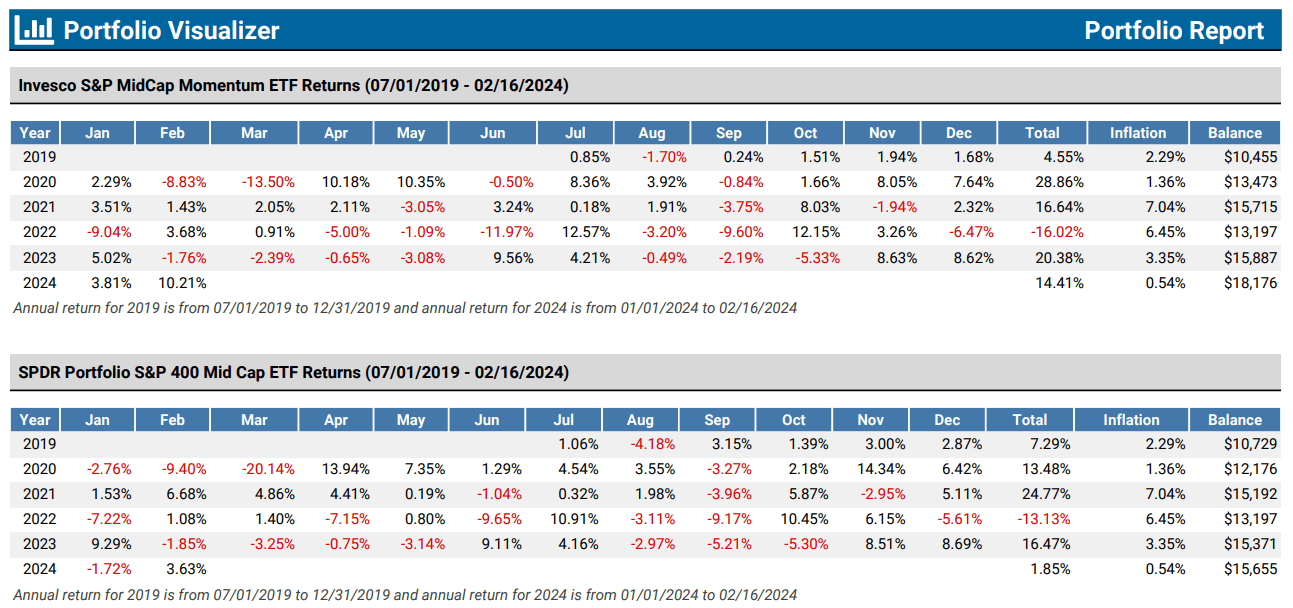
In addition, S&P Dow Jones Indices provides ten-year returns that includes backtested data before November 13, 2017. I downloaded the raw data and applied 0.34% and 0.03% expense ratios to match XMMO and SPMD and calculated the following annual returns:
- 2015: 7.57% (+9.57%)
- 2016: 8.64% (-12.10%)
- 2017: 19.60% (+3.35%)
- 2018: -9.85% (+1.24%)
- 2019: 23.71% (-2.49%)
- 2020: 29.47% (+15.81%)
- 2021: 17.15% (-7.61%)
- 2022: -15.72% (-2.66%)
- 2023: 20.33% (+3.90%)
The figures in brackets highlight the Index’s performances relative to the S&P 400 Index and indicate the strategy produces inconsistent results. For example, it outperformed by 9.57% in 2015, but then lagged by 12.10% the following year. Similarly, its 15.81% beat in 2020 was followed by 7.61% and 2.66% misses in 2021 and 2022.
I also ask readers to consider the Index’s monthly win rate, which was 61/120 from February 2014 to January 2024. However, its average monthly return (net of fees) was still 0.09% better (0.97% vs. 0.88%), and its annualized standard deviation was lower (16.81% vs. 18.05%). Therefore, my takeaway on performance relative to SPMD is that XMMO is likely a better long-term solution. However, it’s far from guaranteed, and SPMD isn’t necessarily a great mid-cap solution to benchmark against. To illustrate, let’s look at how these returns from 2015-2023 ranked against 33 other mid-cap ETFs. Please note that XMMO’s current Index lagged its prior pure growth Index by 18%, 16%, and 13% from 2017-2019, reinforcing how XMMO’s past results are no longer relevant.
The Sunday Investor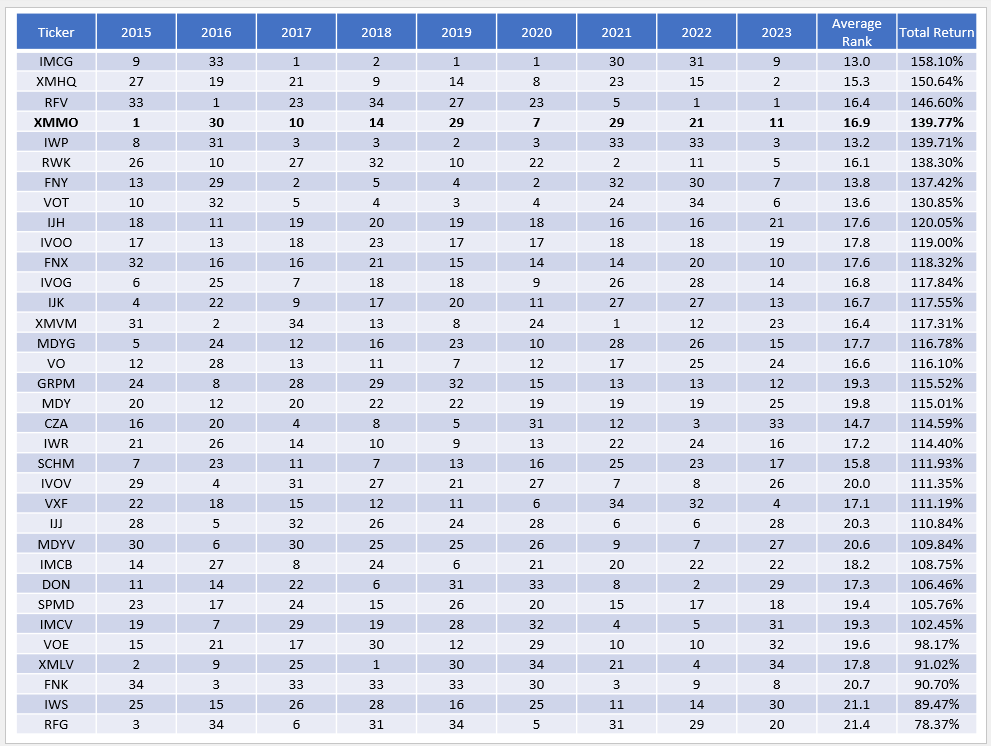
Here are two takeaways:
1. XMMO’s cumulative 139.77% return between 2015-2023 (adjusted for its Index change) ranks fourth-best in this 34-fund sample. The iShares Morningstar Mid-Cap Growth (IMCG), the Invesco S&P MidCap Quality ETF (XMHQ), and the Invesco S&P MidCap 400 Pure Value ETF (RFV) did better, suggesting you should also consider the growth, quality, and value factors.
2. XMMO’s average annual ranking was 16.9, slightly better than the 17.5 average. I use this statistic to understand risk better, as ETFs with great total returns, but poor average rankings often produce inconsistent results. In XMMO’s case, it ranked in the bottom quartile three times (2016, 2019, and 2021) and in the top quartile twice (2015 and 2020), which isn’t the best track record. XMHQ, IWP, VOT, IVOG, and CZA all have better top/bottom quartile ratios, while plain vanilla funds like SPMD and MDY are designed to be average and, thus, are always second- or third-quartile performers. Note that SPMD’s rankings before 2020 are worse than MDY’s due to its Index change.
Given these results, there are at least a few good alternatives to XMMO. I’ve highlighted XMHQ in several comparison articles before, but let’s look at IMCG, RFV, SPMD, and GRPM in more detail. GRPM, like many Invesco ETFs, changed its Index recently (August 25, 2023), and its returns since then have been twice as good as SPMD due to Super Micro Computer.
XMMO Fundamental Analysis
The following table highlights selected fundamental metrics for XMMO’s top 25 holdings, totaling 61.27%, and makes it one of the more concentrated mid-cap ETFs available. Please note that XMHQ and GRPM are also concentrated funds with relatively high weights assigned to SMCI.
The Sunday Investor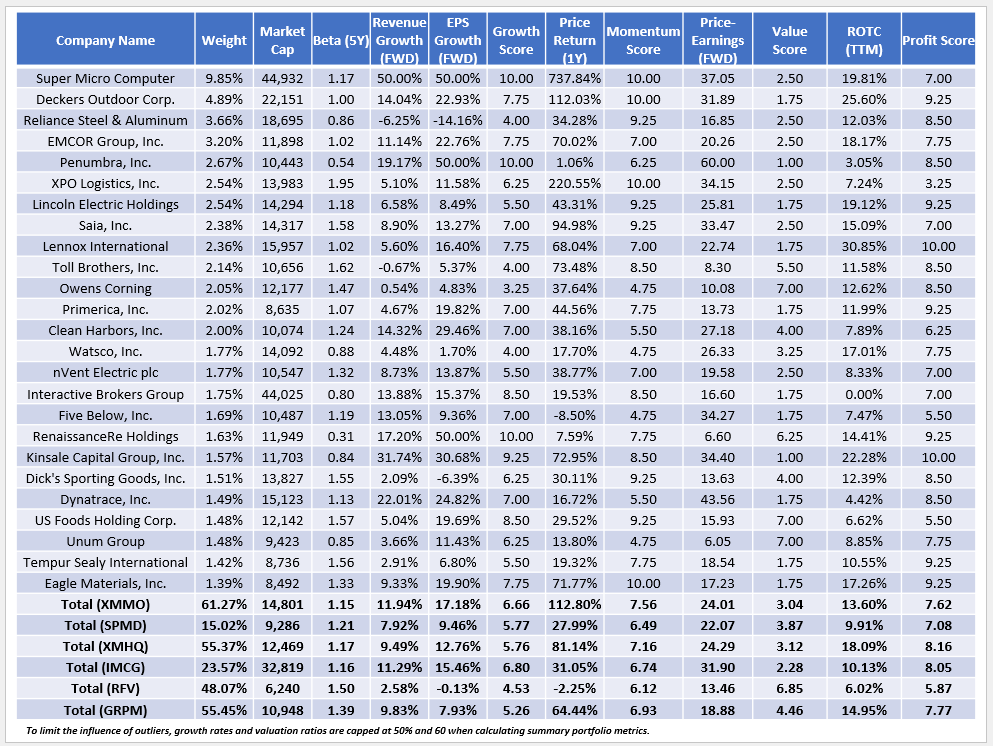
I have two additional takeaways:
1. XMMO’s constituents have a 7.56/10 Momentum Score, which I derived from individual Seeking Alpha Momentum Grades. Most holdings have high scores, but the ones that don’t like Owens Corning (OC) reflect how there are different ways to measure momentum. XMMO’s method relies on one-year price changes, but Seeking Alpha’s system is more comprehensive and arguably provides a better “live” picture of high-momentum stocks. As shown below, OC receives an “A-” grade on one-year price performance but a “C” on three- and six-month returns. Based on the overall “C” grade, the system emphasizes these short-term measurements more.
Seeking Alpha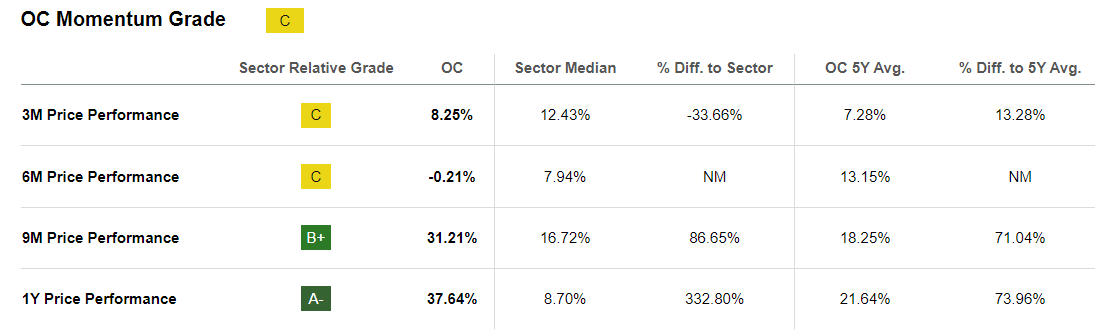
XMHQ also has a high 7.16/10 momentum score, followed by GRPM, IMCG, SPMD, and RFV. RFV is almost designed to be an “anti-momentum” ETF, as its selections typically have depressed stock prices. However, as the earlier performance analysis showed, the strategy also has worked well.
2. I mentioned earlier how XMMO is structured like a growth ETF at the moment, and its estimated 11.94% and 17.18% sales and earnings per share growth rates provide confirmation. These growth rates are better than what IMCG features, and its 6.66/10 sector-adjusted growth score is nearly as good. However, its 3.04/10 value score is low, so for now, I would categorize XMMO as an excellent momentum and growth ETF only. RFV could be used to balance things out.
Reconstitution Preview: High Turnover Continues
Please note that the S&P Composite 1500 Index rebalances quarterly after the close of business on the third Friday of March, June, September, and December, with the reference date one week prior. However, the reference dates for the S&P MidCap 400 Momentum Index are the last business days of February and August, so I don’t believe SMCI will be removed at the subsequent reconstitution. That means SMCI will continue to dominate many momentum and growth-focused mid-cap funds, and based on Friday’s decline, it could be a bumpy ride.
Still, I expect an improvement from a diversification perspective. Based on my rough calculations, Industrials exposure should decline from 34% to 26%, with offsets in Technology and Consumer Discretionary. I estimate approximately 50% of the portfolio’s holdings will be replaced for this six-month period, consistent with the turnover rates posted since the June 2019 Index change.
Invesco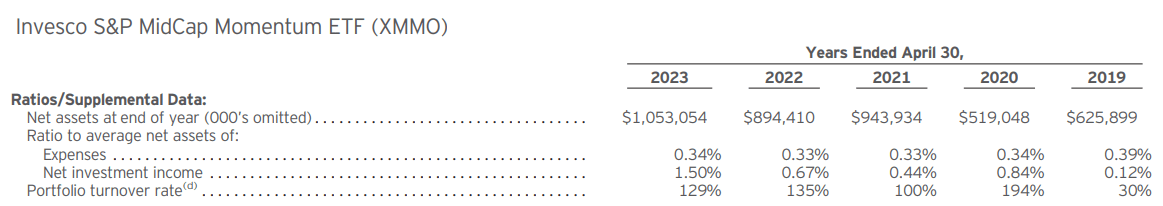
Investment Recommendation
The S&P MidCap 400 Momentum Index outperformed the S&P MidCap 400 Index over the last decade, but its performance was inconsistent. The Momentum Index lagged substantially in 2016 and 2021 but beat in 2015, 2020, and most recently in 2024 due to a high weighting assigned to Super Micro Computer. Its monthly win rate of 61/120 is only average, and in my performance analysis, I found other top-performing ETFs like IMCG, XMHQ, and RFV offered more consistent returns. This is evidence that the momentum factor, at least how S&P Dow Jones Indices apply it, is not the only one investors should consider.
XMMO’s fundamentals are solid, as it competes well with IMCG and XMHQ on growth and quality factors. However, I’m uncomfortable with SMCI’s 10% weighting and the volatile road ahead its inclusion will mean until the September rebalancing. Therefore, I recommend patience and have assigned a “hold” rating until XMMO becomes better diversified. Thank you for reading, and I look forward to your comments below.

 Q2 2024 Earnings Call Transcript")

