da-kuk
January 2024 in Review
2024 began on a high note with an earnings season that surpassed expectations, buoyed by contained inflation and stable interest rates. The Dow Jones Industrial Average saw a modest uptick of 0.4%, closing the month at 38,467 points, edging ever closer to the significant milestone of 40,000 points. Similarly, although the S&P 500 remained relatively flat in January, it closed at 4,925 points, eagerly poised to breach the 5,000-point mark.
While these psychological thresholds often garner attention due to their appeal to human psychology, personally, their significance is negligible to my long-term investment strategy. Whether we witness a surge to new all-time highs prompting further market enthusiasm or a healthy correction, I consistently favor the latter.
While concerns linger about the prospect of a soft landing, I remain optimistic that any economic downturn, if at all, would likely be short-lived similar to the 2022 bear market, which, in hindsight, was inconsequential.
In January, AI leader Nvidia (NVDA) emerged as a standout performer in the stock market, experiencing a remarkable surge of nearly 25%, dominating the market landscape. This momentum was mirrored by other tech giants like Advanced Micro Devices (AMD), Broadcom (AVGO), and Microsoft (MSFT), all exhibiting robust performance. While my holdings in Nvidia have reached notable levels, I anticipate a corrective pullback of at least 10% from its current meteoric rise. Nonetheless, my confidence in Nvidia’s long-term prospects remains unwavering. Predicting its precise valuation today is speculative, but I firmly believe its stock price will surpass current levels over the 5-10 year investment horizon (which is what matters to me), irrespective of short-term fluctuations.
With earnings scheduled for February 21, all eyes are on Nvidia’s guidance and its ability to sustain current market expectations. The question looms: Can it justify the rapid rise in expectations, and at what point will it satisfy demand to the extent that future investment cycles may slow? Ultimately, the demand for Nvidia’s GPUs is tethered to corporate IT budgets, and while colossal investments from tech giants like Microsoft or Meta may not materialize annually, their periodic cycles of investment remain a significant factor.
Portfolio Changes in January
After enjoying a refreshing December Holiday break, I jumped back into my investments in January. I managed to put around $1,760 into the market, mostly focusing on my go-to favorite, BDCs (Business Development Companies).
My main picks were Ares Capital (ARCC) and Hercules Capital (HTGC), both big players in the sector alongside the leader, Main Street Capital Corporation (MAIN). These two have been building up some hefty spillover dividends over the past year, which should act as a safety net when net investment income takes a hit from falling interest rates. So, I’m not expecting any dividend hikes soon. Instead, I’m hoping for some special dividends once the Fed starts cutting rates (although why they would do that anytime soon with the economy going strong is beyond me).
If we do get those special dividends, it could bring down stock prices, making the yields even more attractive for future purchases. In January, my moves added $122 to my yearly dividend income, kicking off the year on a positive note. My aim is to lift my dividend income by about $100 each month, mostly doable thanks to the high yields from BDCs.
Overall, the average yield on cost of my new investments in January averaged around 6.7%, reinforcing my belief in BDCs as a core part of my portfolio. I’m banking on their dividends staying steady—that’s what I’m all about when it comes to generating income. Time will tell if I’m on the money or just overly optimistic.
All these purchases break down as follows:
Added Dividend Income (Designed by author)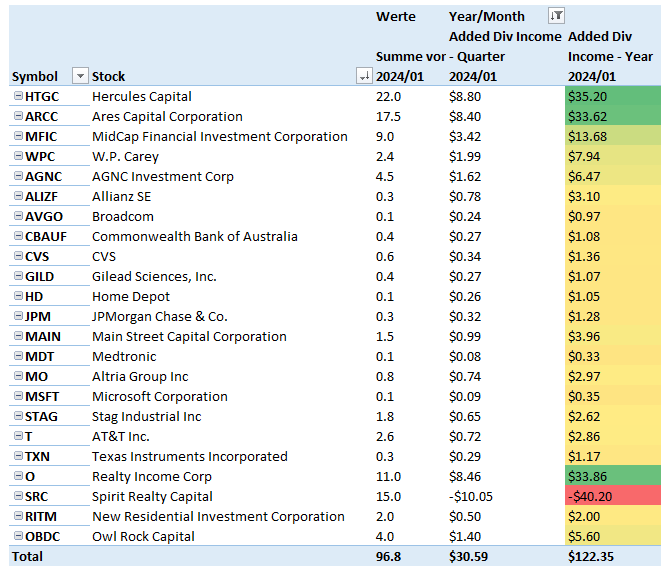
All net purchases in January can be found below:
Net Purchases in January (Designed by author)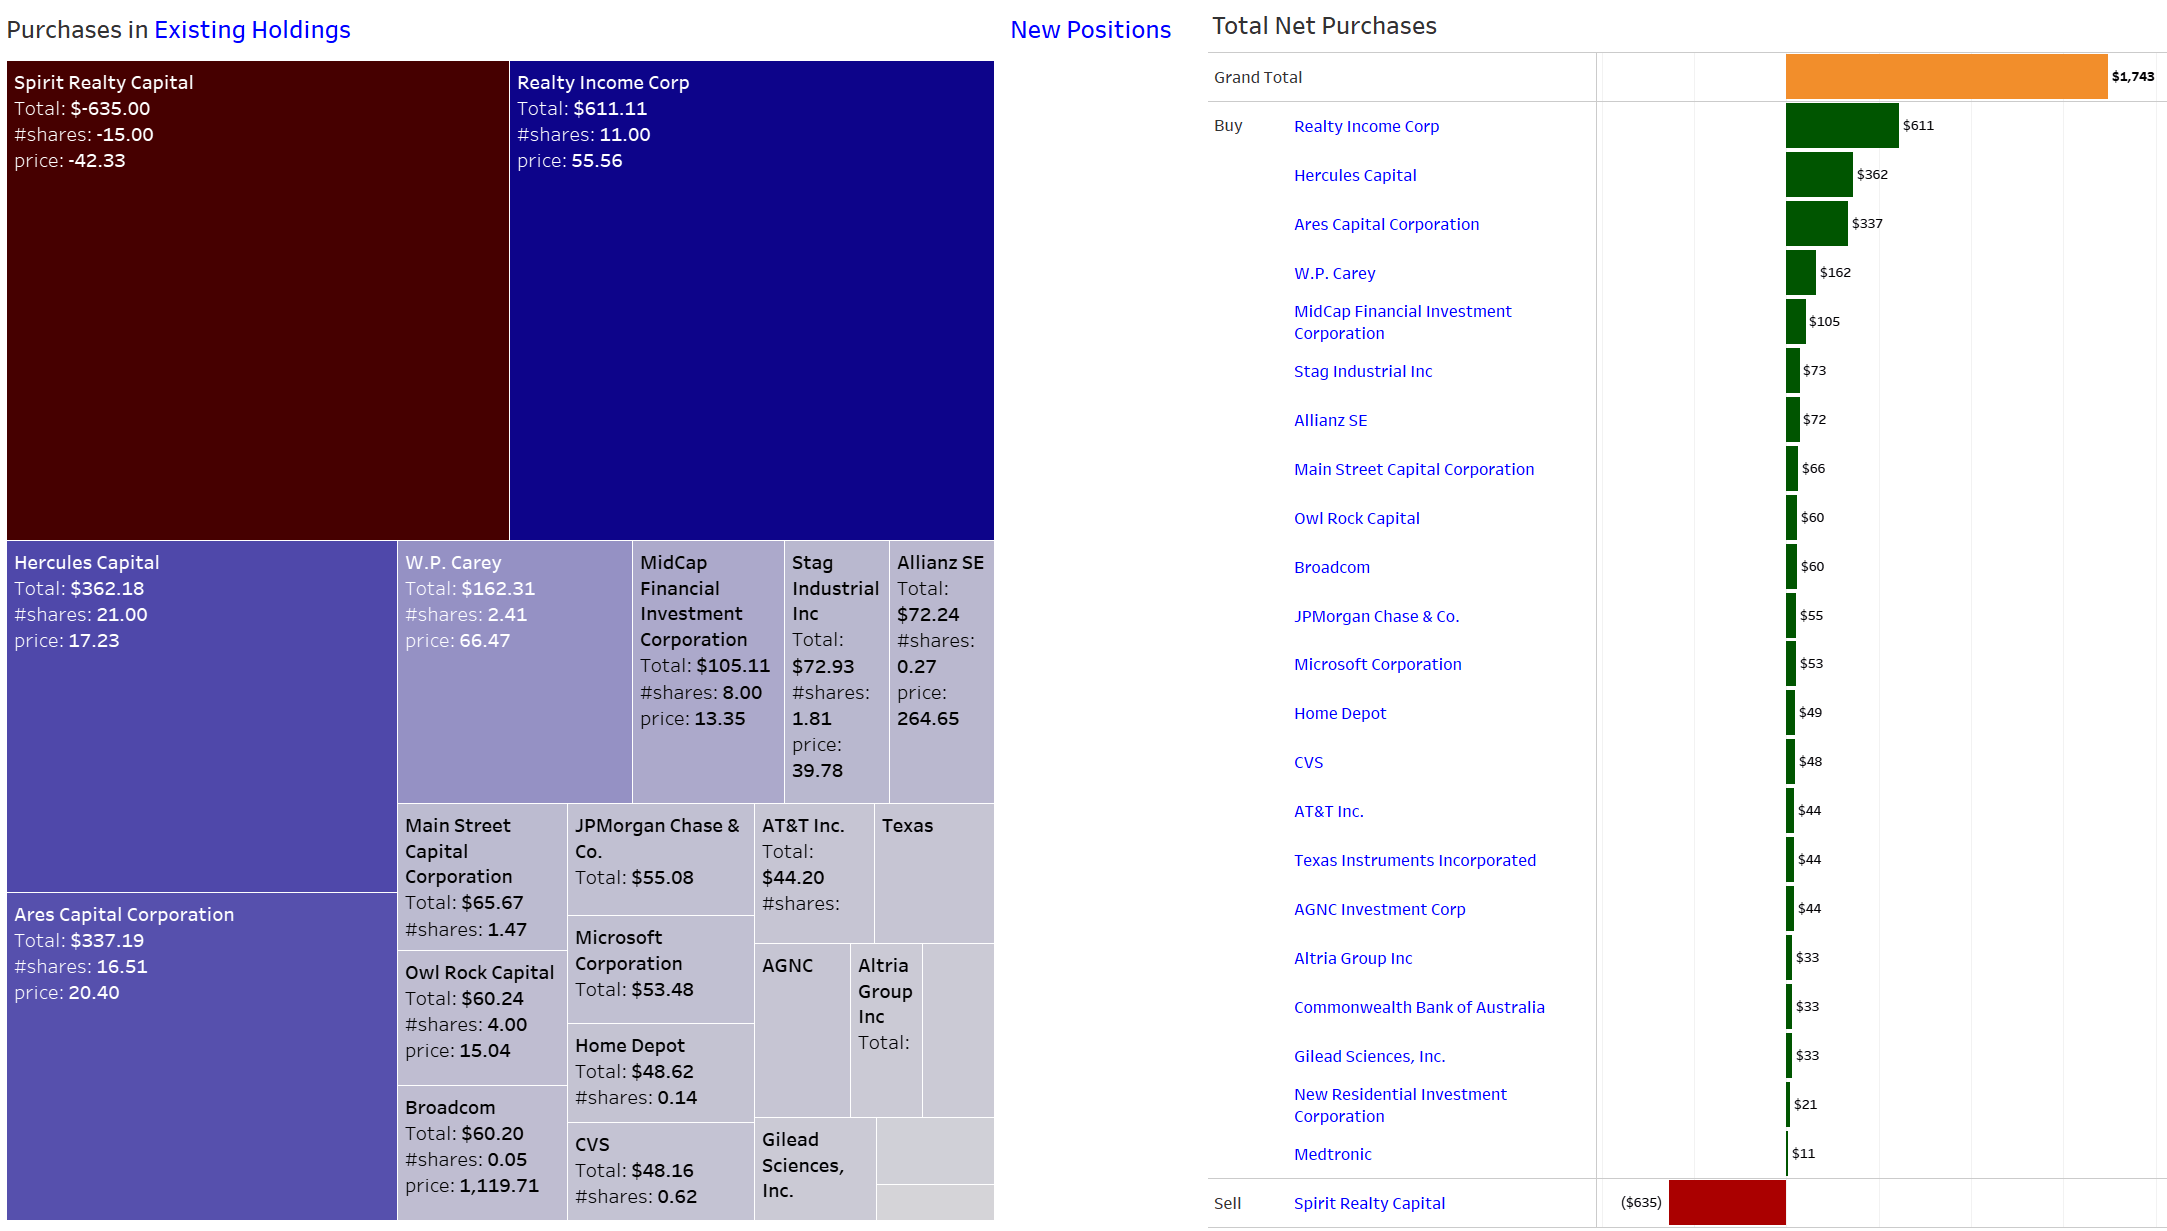
Dividend Income January 2024
Dividend income hit a new all-time record for January of $643, up both 5% annually and quarterly.
The most noteworthy development to me was the significant leap in dividends from monthly dividend payers, climbing from $76 to $102 over the past year. This steady increase means that extra cash is coming in every single month, which is pretty sweet. This month was the first time that regular income crossed the $100 mark without any special dividends, setting the next target to aim for at $150.
It should also be noted that January 2024 marked the last time I will have received a dividend payment from Spirit Realty Capital following the acquisition by Realty Income (O). To make up for that lost income in January I will continue to invest into Rithm Capital (RITM), W.P. Carey (WPC) and Blue Owl Capital Corporation (OBDC).
January 2024 Dividend Income (Designed by author)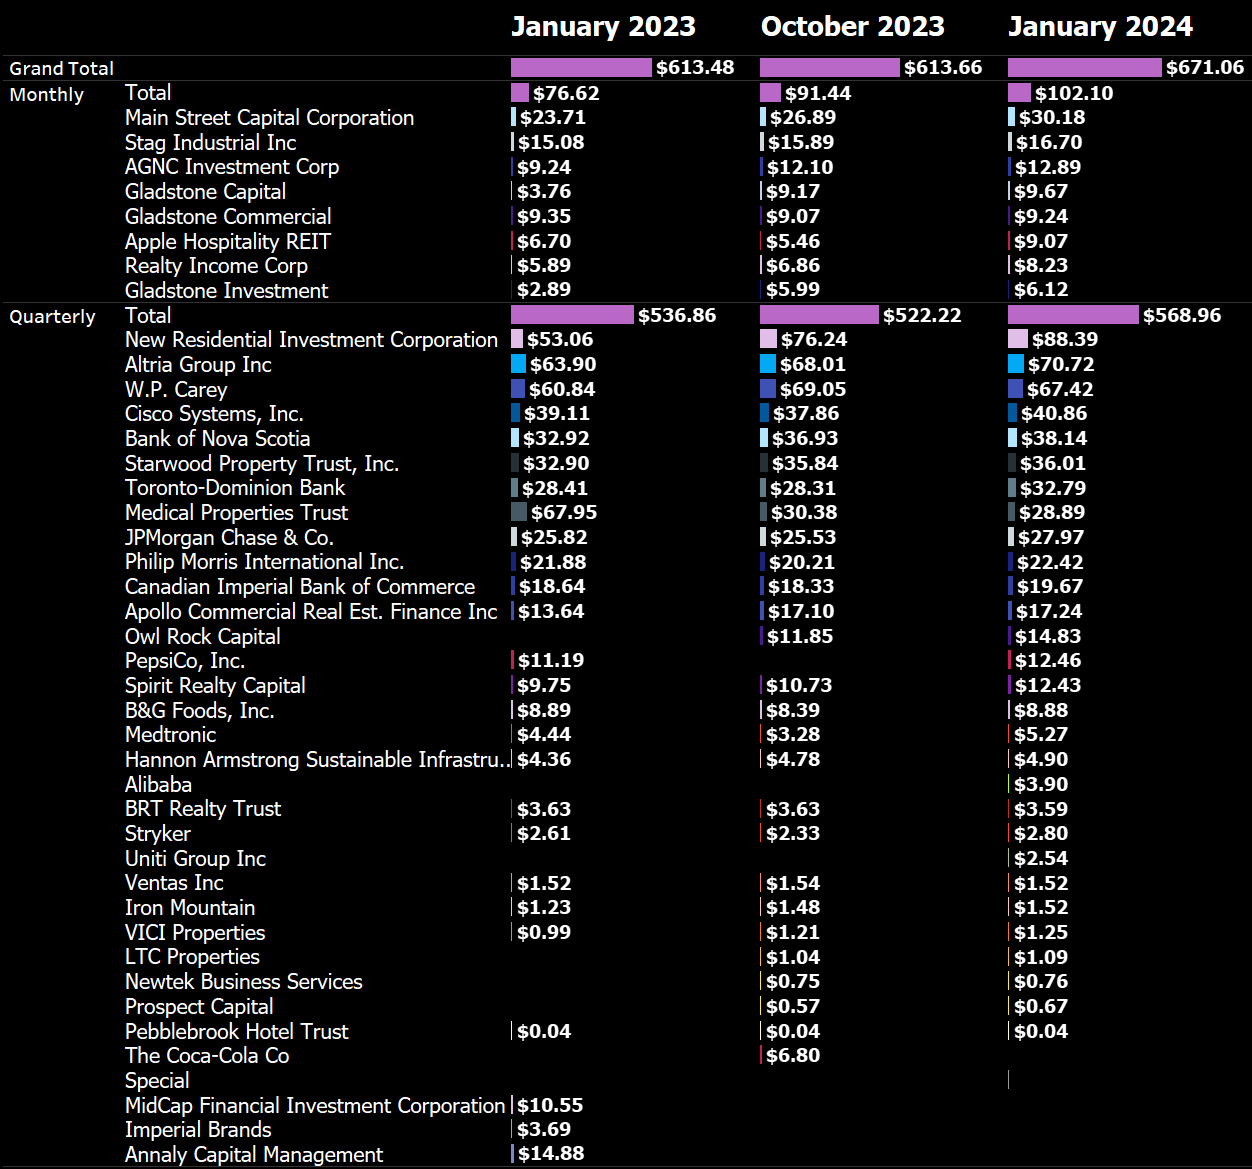
In January, the dividend income from my top three regular payers reached $227, a bump from last year’s average of $195. Looking at it quarterly, we’ve gone from $213 to $227. This uptick is primarily driven by regular investments in both W. P. Carey and Rithm Capital.
All this is depicted below:
Top 3 Dividend Payers (Designed by author)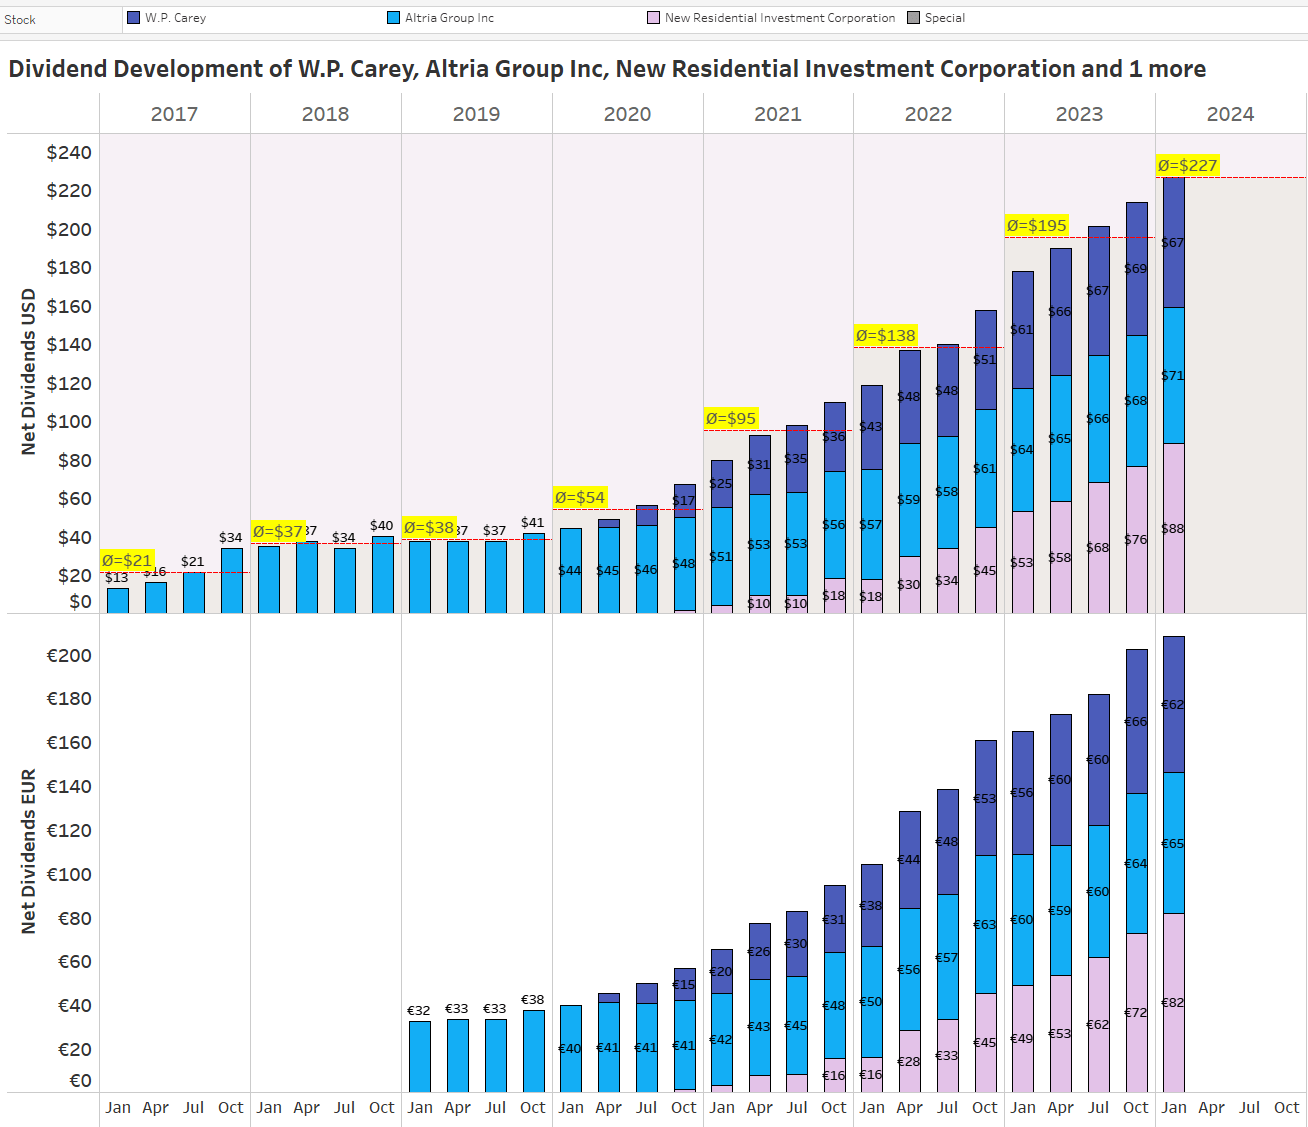
Here is a chart that shows the development of my net dividend income by month over time between 2015 and 2023. You can see the growth of my dividend income and the average annual dividend for each year:
All-time Dividend Development (Designed by author)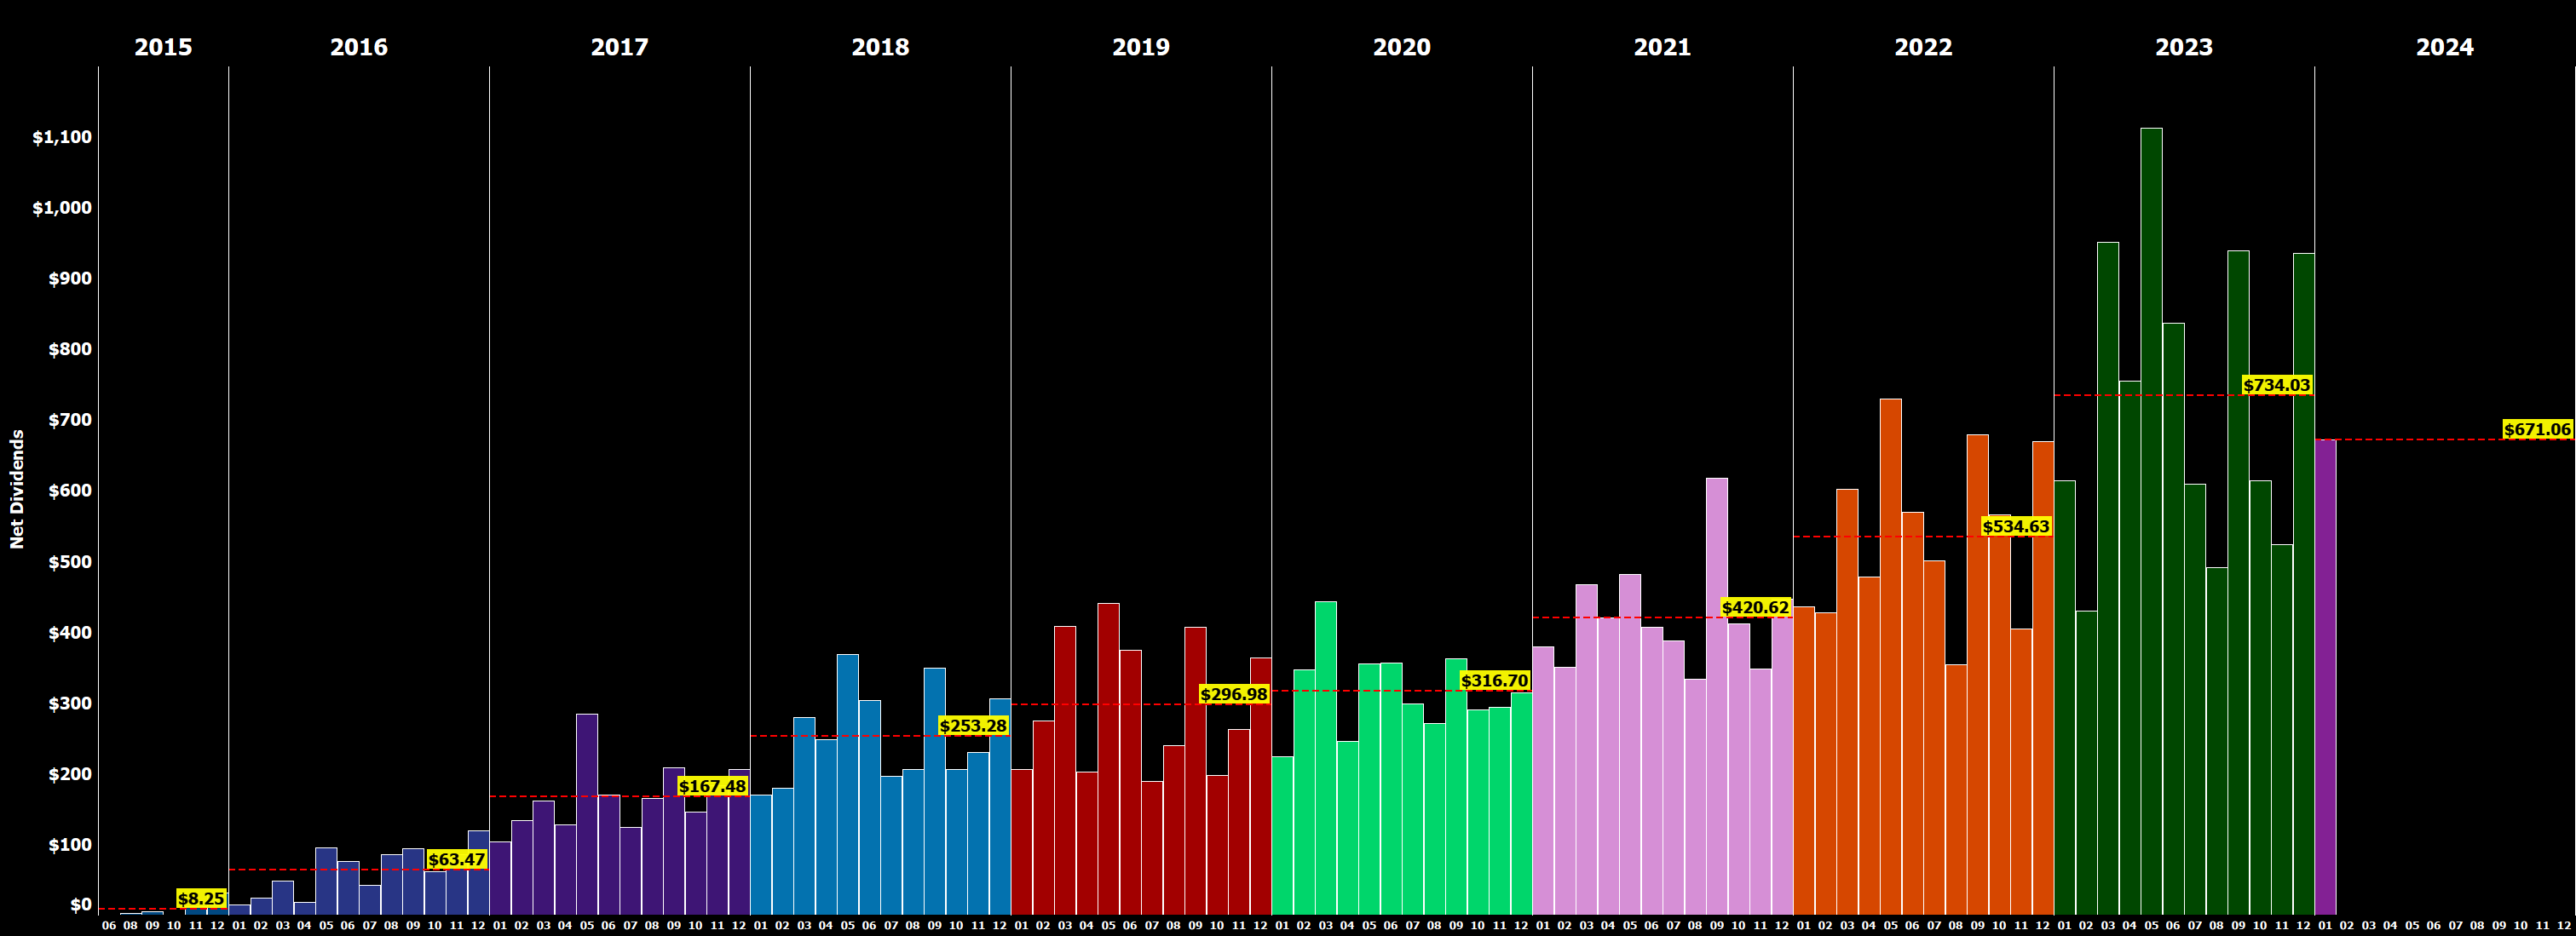
This chart is my favorite because it illustrates the progression of my dividend income over time and allows me to easily see the average annual dividend for each year.
Next, I have plotted all of the individual dividend payments I have received, coloring them by year and arranging the years side by side instead of horizontally as in previous updates. This visualization allows for a more comprehensive analysis of the distribution of my dividend payments over time.
Dividend Payment Bubbles (Designed by author)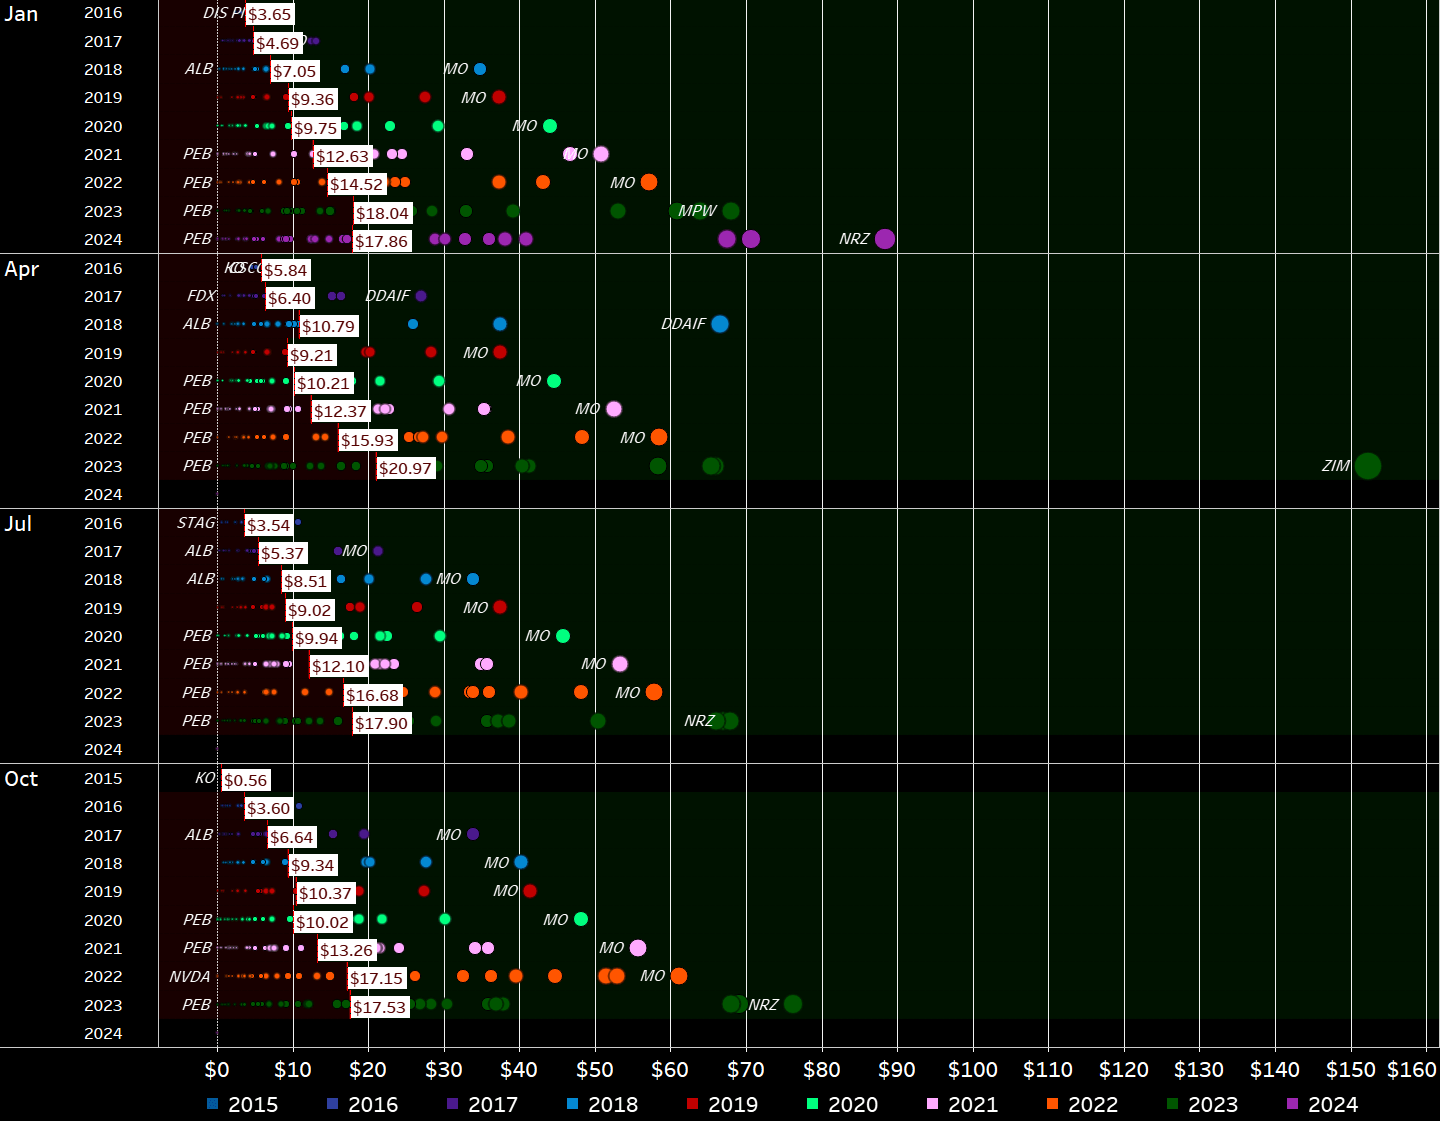
By visualizing the data in this manner, we get a clear picture of how dividend payments are spread out over different years, offering valuable insights into the overall growth of my dividend income over the years.
This visualization is initially quite cluttered, but it contains a wealth of information. It shows every individual dividend payment I have received since I began my investment journey in 2015, represented as a circle that is colored and sized according to its contribution. The view is organized by month and year, allowing for a more comprehensive analysis of the development of my dividend income over time. For each year and month, a white rectangle indicates the average monthly dividend. The area where dividends fall below the average is filled in dark red, while the area above the average is colored dark green.
This type of data visualization allows for a detailed examination of the distribution of my dividend payments over time and enables me to easily identify trends and patterns in my income growth.
January 2024 Dividends (Designed by author)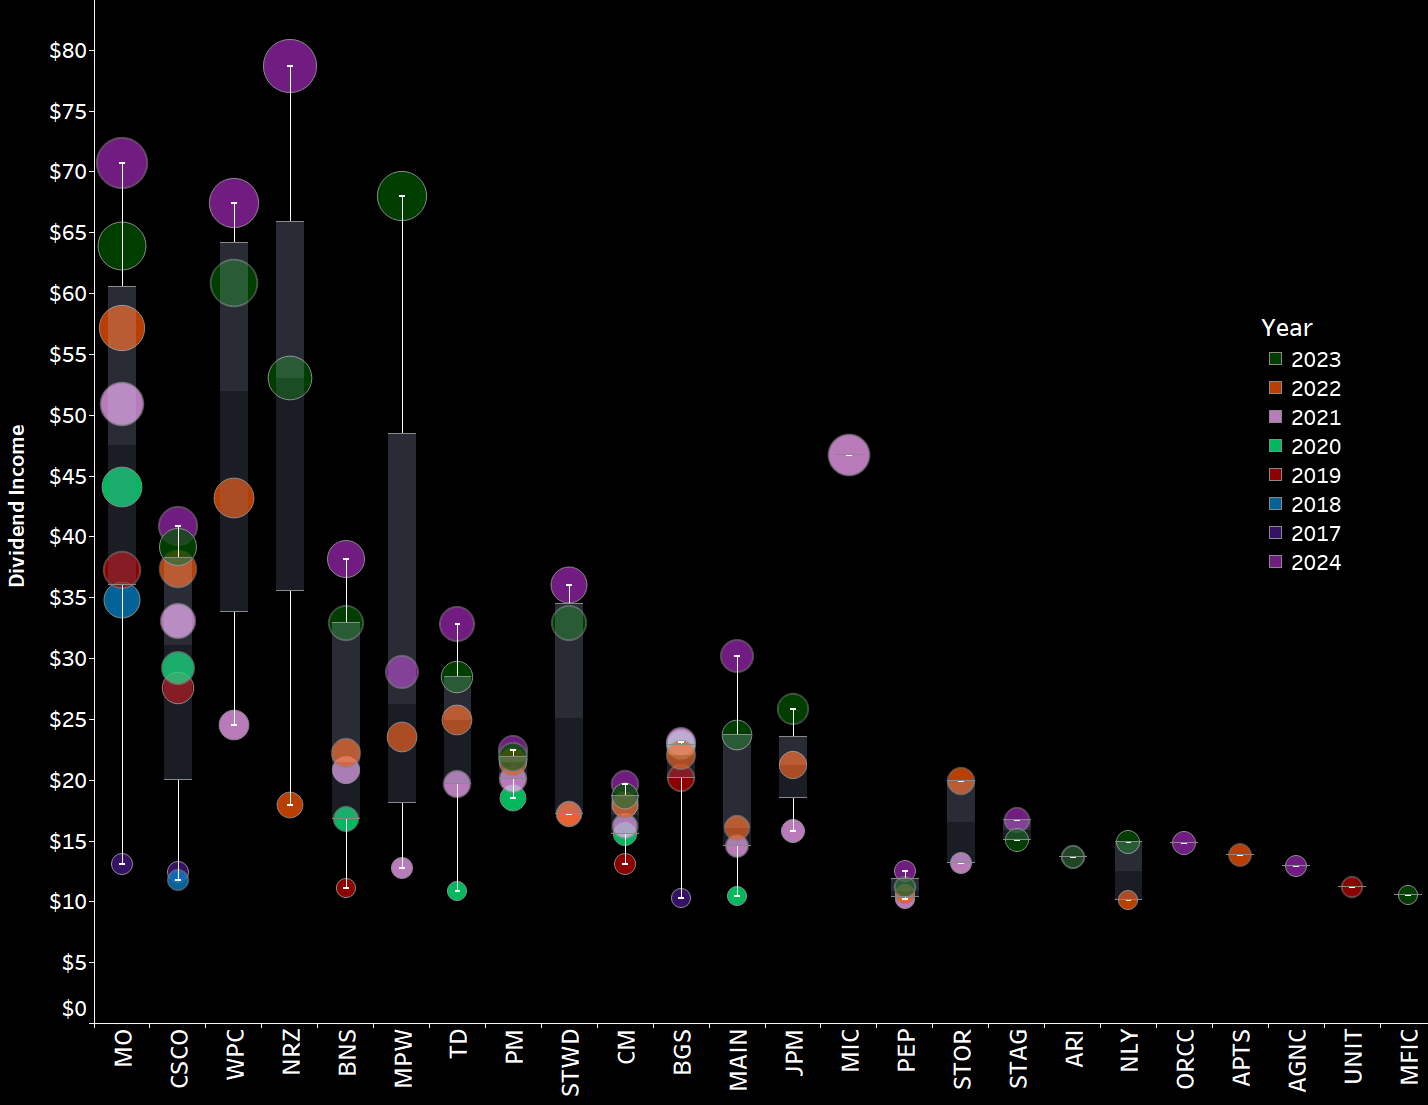
Now zooming in on January, we can immediately see a number of big colorful circles in a sea of black. The bigger the circle and the bigger the distance to the previous circle for the same stock, the bigger is the change in dividend income compared to the prior years.
We can clearly see the dominance and significance of Altria (MO), W. P. Carey, and Rithm Capital. They have a strong presence in the visual representation.
Taking a closer look at the dividends for 2024, I’m pleased to see mostly purple circles at the top of the scale, exactly where I want them to be. These sizable purple circles signify an increase in dividend income, aligning with my goal of maximizing growth. However, one noticeable outlier is the sharp decrease in dividend income from Medical Properties Trust (MPW), stemming from last year’s substantial dividend cut.
Overall, my aim is to observe numerous large orange circles positioned at the highest point on the scale. This signifies a positive trend of increasing dividend income, which is precisely what I’m striving for.
Another way to express the monthly dividend income is in terms of Gifted Working Time (GWT). Assuming an average hourly rate of $36.25 for 2024, my GWT and annual net dividends have been as follows:
- 2018: 121 hours GWT, $3,000 in annual net dividends
- 2019: 142 hours GWT, $3,600 in annual net dividends
- 2020: 152 hours GWT, $3,800 in annual net dividends
- 2021: 180 hours GWT, $5,050 in annual net dividends
- 2022: 229 hours GWT, $6,400 in annual net dividends
- 2023: 272 hours GWT, $8,800 in annual net dividends
- 2024: Targeting at least 248 hours GWT, $9,000 in annual net dividends
The overall target for the year with $9,000 in annual net dividends is very conservative, but I expect that I will have to take out some risk from my portfolio as I am eyeing to raise capital for real estate investments if I encounter the right deal. Still, as the year unfolds, I do expect to be able to pass that target and potentially even reach my next milestone of $10,000 as well. That would be a great achievement but nothing I am banking on to reach this year – it would be the icing on the cake.
Across the years, my YTD Dividend Race has been as follows:
- 2018: Disappointing
- 2019: Phenomenal, benefiting from a low baseline in the prior year
- 2020: Fairly disappointing
- 2021: Phenomenal
- 2022: Much better than expected fueled by the very weak euro
- 2023: Breathtaking
YTD Dividend Growth (Designed by author)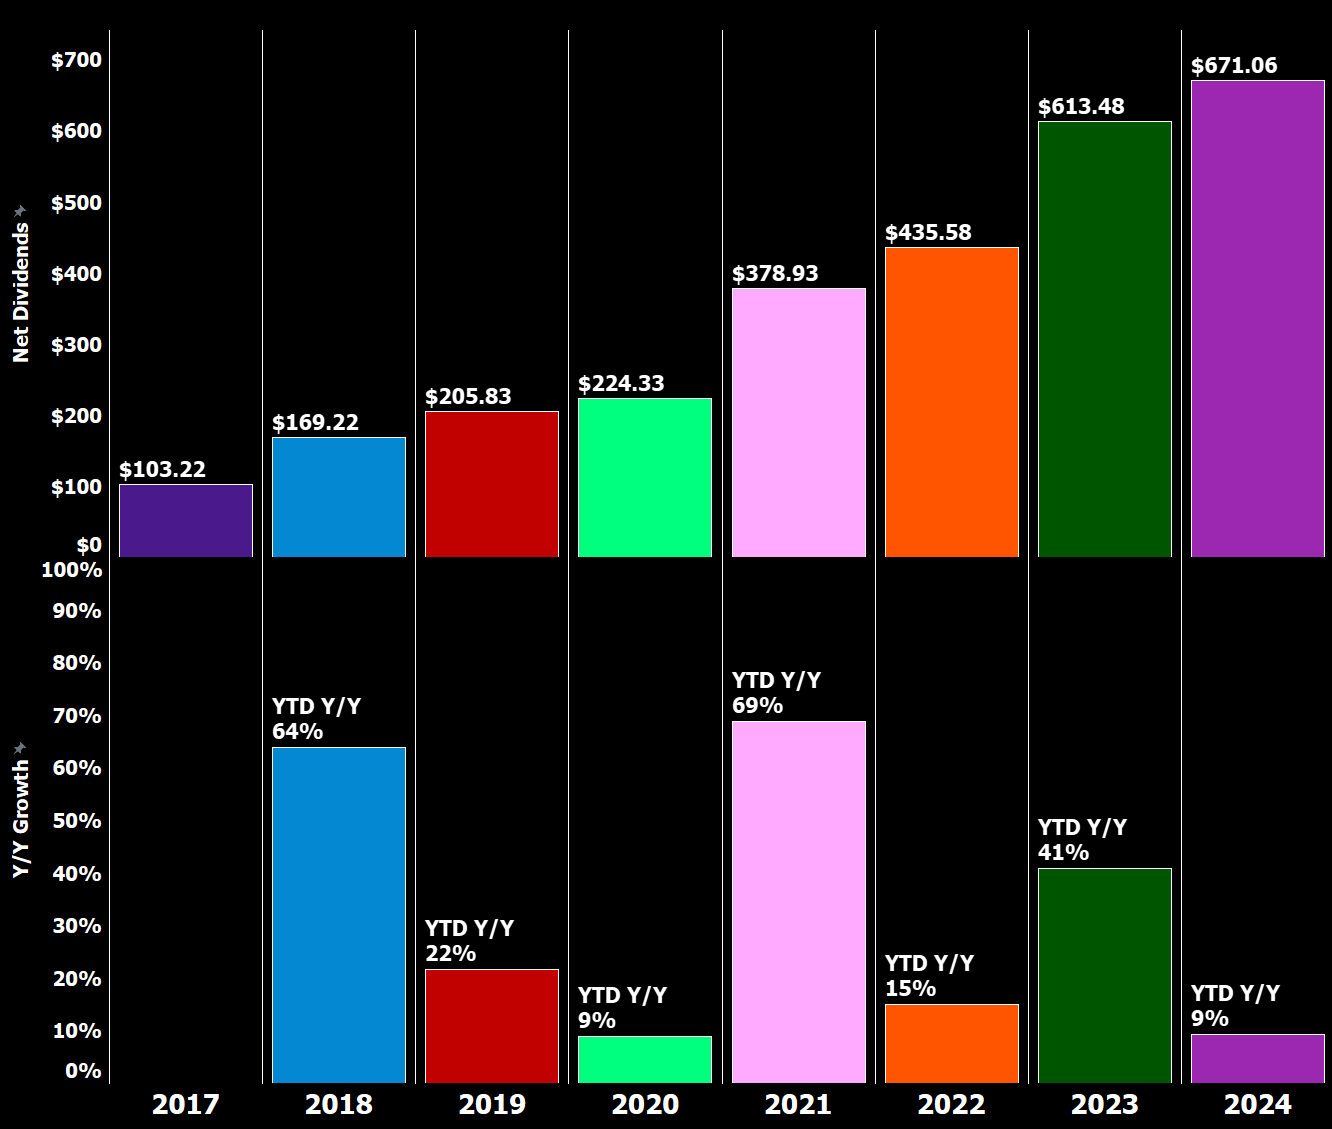
I have updated the YTD Dividend Race chart to show the development of YTD dividend income on a daily basis, allowing us to see that most of my dividend income is generated mid-month and towards the end of the month. The chart also breaks down the development by month for the current year, making it easy to identify significant jumps in income.
YTD Dividend Race (Designed by author)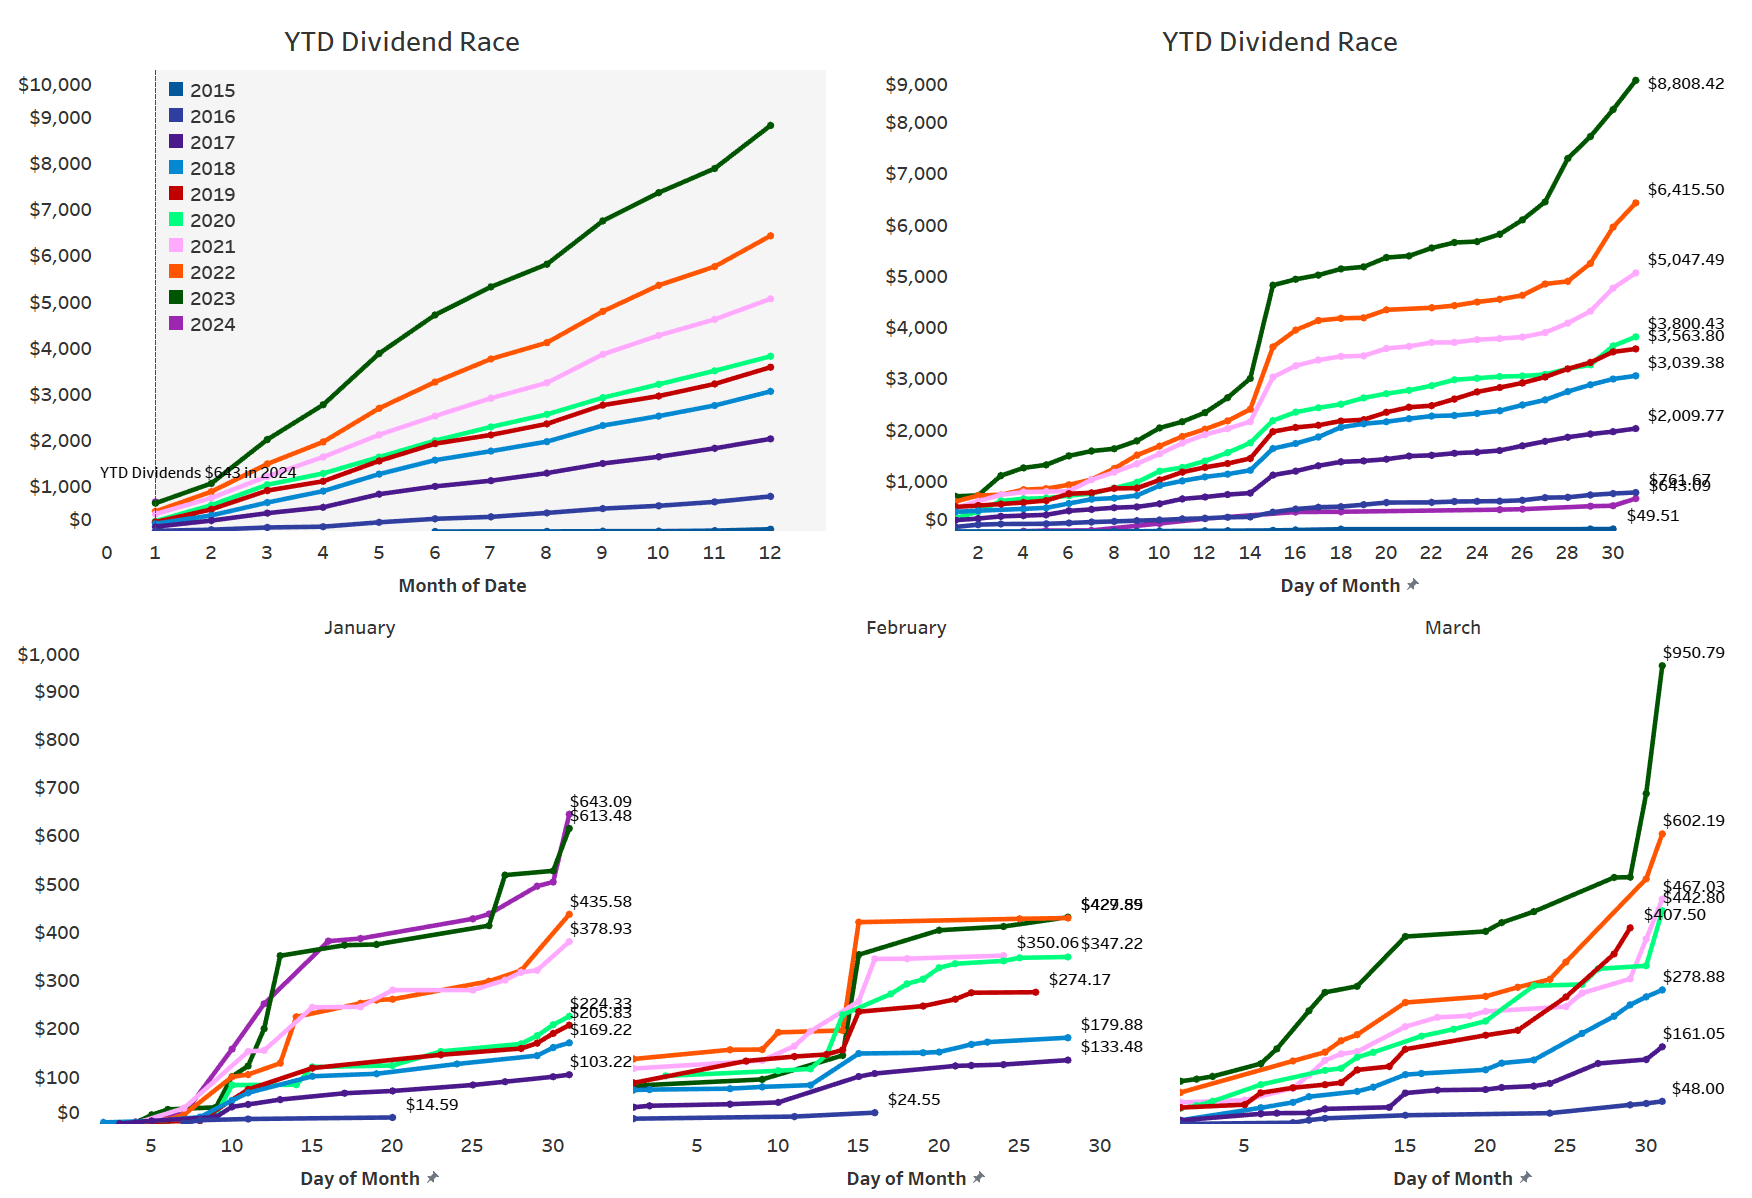
Expressed in GWT, it presents itself as follows:
Gifted Working Time in Hours (Designed by author)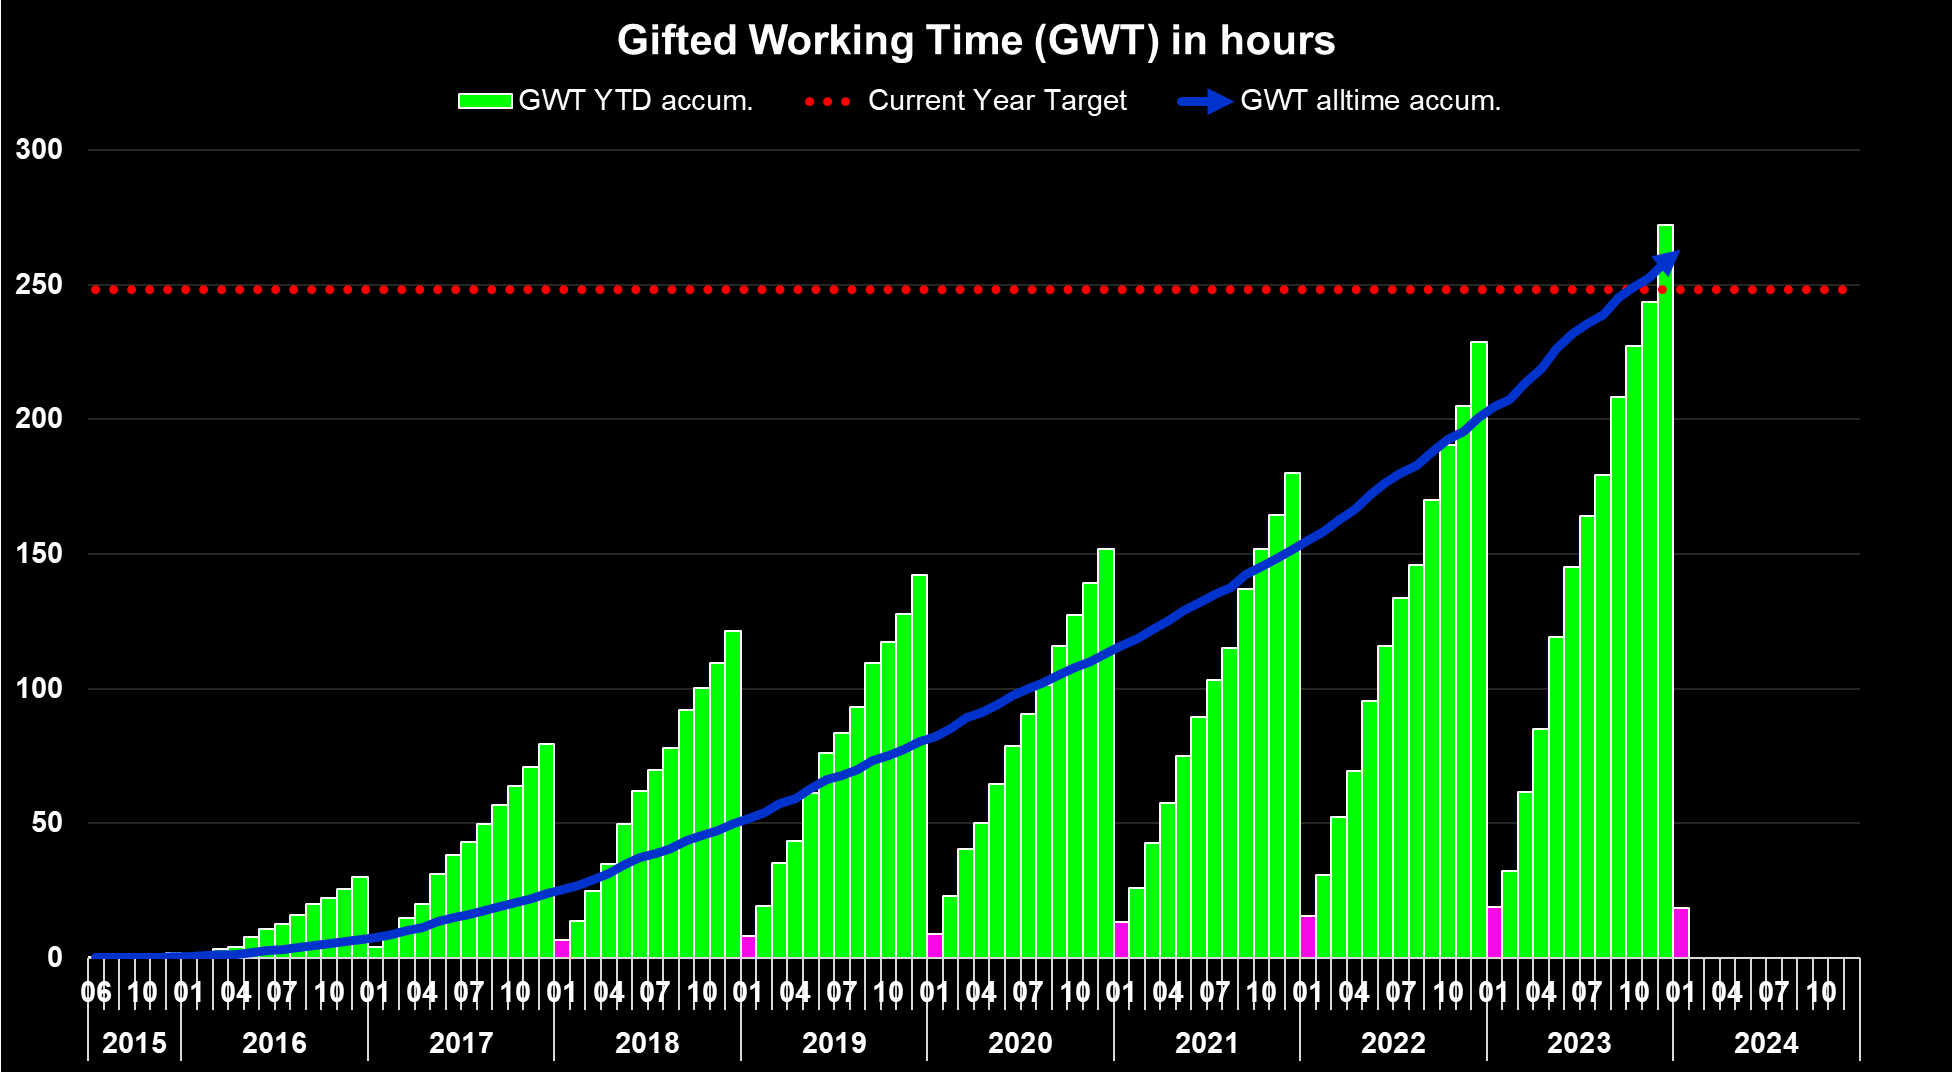
What this shows is as follows:
- All time (blue area) – Around 1,227 hours, or 153 days, of active work have been replaced with passive income since the start of my dividend journey. Assuming a five-day workweek, this translates into almost half a year in total.
- Full-year 2024 (green bars) – Around 19 hours, or 2.3 days, of active work have been replaced with passive income in 2024, which is basically equivalent to half a working week funded with dividends. That is great progress and I can’t wait to add another month to that statistic.
- Highlighted in pink is the accumulated total at the end of the current reporting month (January).
This visualization allows us to see the overall impact of my dividend income on the amount of active work I am able to replace with passive income. It also enables us to see the progress made year-to-date, as well as the accumulated total at the end of the current reporting month.
Upcoming February Dividends
Contrary to January, February features significantly fewer dividend payers but among them are the big annual dividends from German companies as well as the still sizable dividend from AT&T (T). Beyond that dividend payments are overall concentrated in the first half of the month with only one meaningful dividend payment from the Royal Bank of Canada (RY) expected in the second half of February. It is unclear though to me at this stage whether Hercules Capital will again only pay in March or return to its usual dividend payment pattern.
The snapshot below is taken from my free-for-all released Dividend Calendar (make sure to follow instructions in the video) and shows my expected dividend payments in February.
My Dividend Calendar (Designed by author)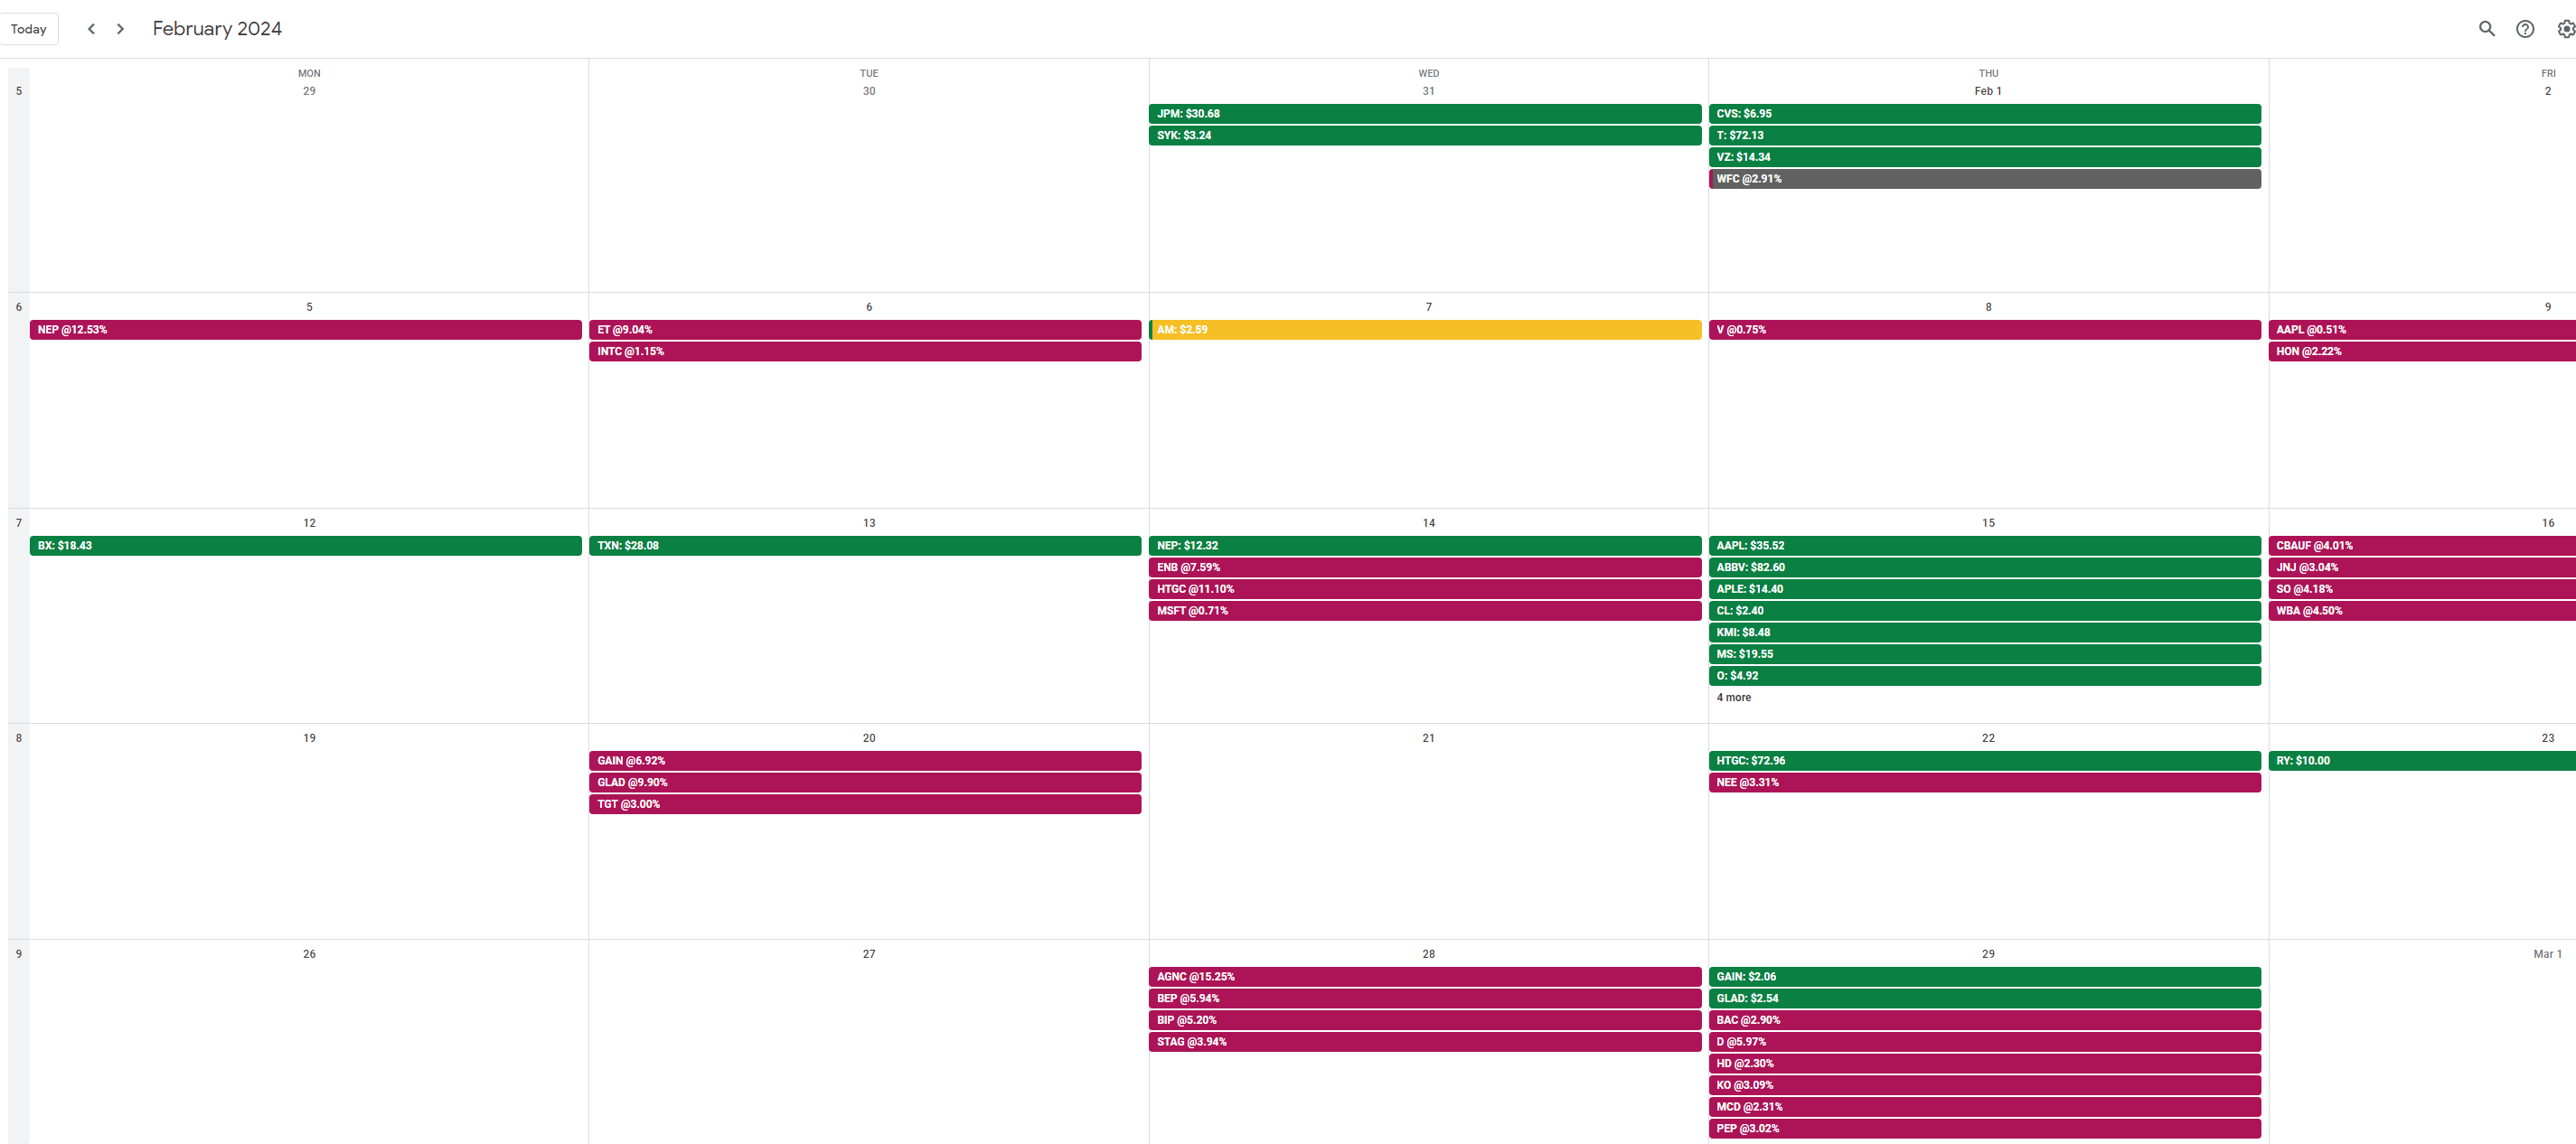
At the end of January, my dividend portfolio is composed as follows:
| Apple Inc. | (AAPL) | 10.94% | 24,246 |
| Visa Inc. | (V) | 4.40% | 9,740 |
| NVIDIA Corporation | (NVDA) | 4.26% | 9,446 |
| Microsoft Corporation | (MSFT) | 4.18% | 9,269 |
| AbbVie Inc | (ABBV) | 3.78% | 8,366 |
| Ares Capital Corporation | (ARCC) | 3.58% | 7,920 |
| McDonald’s Corp. | (MCD) | 3.32% | 7,346 |
| Commonwealth Bank of Australia | (OTCPK:CBAUF) | 2.55% | 5,653 |
| Main Street Capital Corporation | (MAIN) | 2.39% | 5,305 |
| Cisco Systems, Inc. | (CSCO) | 2.35% | 5,204 |
| Broadcom Inc. | (AVGO) | 2.15% | 4,758 |
| Stag Industrial Inc | (STAG) | 2.10% | 4,642 |
| JPMorgan Chase & Co. | (JPM) | 2.08% | 4,600 |
| W.P. Carey | (WPC) | 2.04% | 4,527 |
| Allianz SE | (OTCPK:ALIZF) | 2.00% | 4,426 |
| AT&T Inc. | (T) | 1.99% | 4,404 |
| Home Depot | (HD) | 1.94% | 4,305 |
| Johnson & Johnson | (JNJ) | 1.94% | 4,287 |
| Shell | (SHEL) | 1.88% | 4,164 |
| Hercules Capital | (HTGC) | 1.88% | 4,159 |
| Texas Instruments Incorporated | (TXN) | 1.59% | 3,526 |
| Wells Fargo & Co. | (WFC) | 1.48% | 3,278 |
| Gilead Sciences, Inc. | (GILD) | 1.46% | 3,234 |
| New Residential Corporation | (RITM) | 1.39% | 3,078 |
| Southern Co. | (SO) | 1.35% | 2,981 |
| Blackstone Group LP | (BX) | 1.34% | 2,968 |
| Toronto-Dominion Bank | (TD) | 1.30% | 2,876 |
| Altria Group Inc. | (MO) | 1.29% | 2,866 |
| Intel Corporation | (INTC) | 1.25% | 2,774 |
| Apollo Investment | (MFIC) | 1.20% | 2,654 |
| Siemens Healthineers | (OTCPK:SEMHF) | 1.17% | 2,600 |
| Bank of Nova Scotia | (BNS) | 1.17% | 2,598 |
| Enbridge | (ENB) | 1.09% | 2,412 |
| BMW | (OTCPK:BMWYY) | 0.99% | 2,184 |
| Realty Income Corp. | (O) | 0.83% | 1,835 |
| Procter & Gamble Co. | (PG) | 0.80% | 1,780 |
| PepsiCo, Inc. | (PEP) | 0.78% | 1,735 |
| BP2 | (BP) | 0.78% | 1,732 |
| Morgan Stanley | (MS) | 0.78% | 1,719 |
| BP1 | (BP) | 0.77% | 1,705 |
| Daimler | (OTCPK:MBGAF) | 0.71% | 1,575 |
| Philip Morris International Inc. | (PM) | 0.63% | 1,389 |
| Starwood Property Trust, Inc. | (STWD) | 0.61% | 1,360 |
| Honeywell International Inc. | (HON) | 0.61% | 1,343 |
| Bank of America Corp. | (BAC) | 0.58% | 1,292 |
| Stryker | (SYK) | 0.56% | 1,247 |
| Brookfield Renewable Partners | (BEP) | 0.48% | 1,064 |
| Gladstone Investment | (GAIN) | 0.47% | 1,036 |
| The Coca-Cola Co. | (KO) | 0.47% | 1,035 |
| Target Corporation | (TGT) | 0.45% | 991 |
| Gladstone Capital | (GLAD) | 0.43% | 964 |
| Gladstone Commercial Corporation | (GOOD) | 0.43% | 950 |
| Unilever NV ADR | (UL) | 0.43% | 943 |
| CVS Health Corp. | (CVS) | 0.42% | 934 |
| AGNC Investment Corporation | (AGNC) | 0.40% | 885 |
| Royal Bank of Canada | (RY) | 0.38% | 839 |
| Apple Hospitality REIT | (APLE) | 0.38% | 835 |
| Sino AG | (XTP.F) | 0.37% | 813 |
| 3M Co. | (MMM) | 0.36% | 807 |
| Annaly Capital Management | (NLY) | 0.36% | 806 |
| Verizon Communications Inc. | (VZ) | 0.35% | 777 |
| Medtronic | (MDT) | 0.34% | 748 |
| NextEra Energy Partners LP | (NEP) | 0.34% | 746 |
| Canadian Imperial Bank of Commerce | (CM) | 0.28% | 624 |
| Vonovia | (OTCPK:VONOY) | 0.28% | 621 |
| BASF | (OTCQX:BASFY) | 0.28% | 616 |
| Dominion Energy Inc. | (D) | 0.26% | 583 |
| Antero Midstream Corporation | (AM) | 0.26% | 579 |
| NextEra Energy | (NEE) | 0.25% | 549 |
| Apollo Commercial Real Est. Finance Inc. | (ARI) | 0.25% | 545 |
| Exxon Mobil Corporation | (XOM) | 0.24% | 521 |
| Medical Properties Trust | (MPW) | 0.23% | 504 |
| Kinder Morgan Inc. | (KMI) | 0.20% | 435 |
| Mastercard | (MA) | 0.19% | 420 |
| B&G Foods, Inc. | (BGS) | 0.19% | 414 |
| Sixt | (OTC:SXTSY) | 0.17% | 372 |
| Colgate-Palmolive Company | (CL) | 0.17% | 366 |
| Walgreens Boots Alliance Inc. | (WBA) | 0.16% | 360 |
| Owl Rock Capital Corporation | (OBDC) | 0.15% | 335 |
| ZIM Integrated Shipping Services | (ZIM) | 0.15% | 333 |
| Alibaba Group Holding Ltd. | (BABA) | 0.15% | 325 |
| Pfizer Inc. | (PFE) | 0.15% | 324 |
| Omega Healthcare Investors Inc. | (OHI) | 0.13% | 292 |
| BRT Realty Trust | (BRT) | 0.11% | 242 |
| Blue Owl Capital | (OWL) | 0.09% | 205 |
| Bayer AG | (OTCPK:BAYZF) | 0.08% | 174 |
| Fresenius SE | (OTCPK:FSNUF) | 0.07% | 145 |
| Spirit Realty Corporation | (SRC) | 0.06% | 143 |
| Boeing | (BA) | 0.06% | 133 |
| Equitrans Midstream Corporation | (ETRN) | 0.06% | 122 |
| Diversified Healthcare Trust | (DHC) | 0.04% | 100 |
| Uniti Group Inc. | (UNIT) | 0.04% | 89 |
| Walt Disney Co. | (DIS) | 0.04% | 84 |
| Bank of Montreal | (BMO) | 0.04% | 80 |
| The GEO Group Inc. | (GEO) | 0.03% | 70 |
| Fresenius Medical Care | (FMS) | 0.03% | 70 |
| Newtek Business Services | (NEWT) | 0.02% | 50 |
| Service Properties Trust | (SVC) | 0.01% | 33 |
Editor’s Note: This article discusses one or more securities that do not trade on a major U.S. exchange. Please be aware of the risks associated with these stocks.

 Q2 2024 Earnings Call Transcript")

