Olena_T
The price action in the CEF market over the last few months has been fast and furious. The apparent Fed pivot and the associated drop in both credit spreads and interest rates has renewed investor confidence in the market, pushing prices and NAVs higher. Large moves can be disorienting for allocation so in this article we go back to basics. Specifically, we revisit the key decision factors of income investing that can streamline and organize the allocation process as applied to CEFs.
These decision factors are intended to allow investors to make rational allocation decisions with regard to the broader CEF space, particularly in the context of fixed-income (i.e. non-equity) CEFs. The core idea is that basing investment decisions on an appropriate framework should result in a greater likelihood of investors achieving their goals.
We focus on six CEF allocation decision factors, three macro and three micro. The macro factors have to do with the broader income market, specifically the level of interest rates and credit spreads and the yield curve. The three micro factors focus on CEFs as such, specifically on leverage, quality and discounts.
Key Macro Factors
There are different ways to gauge the level of interest rates. One proxy, the 5Y Treasury yield, shows that rates are fairly elevated and were only higher prior to two recessions this century.
Systematic Income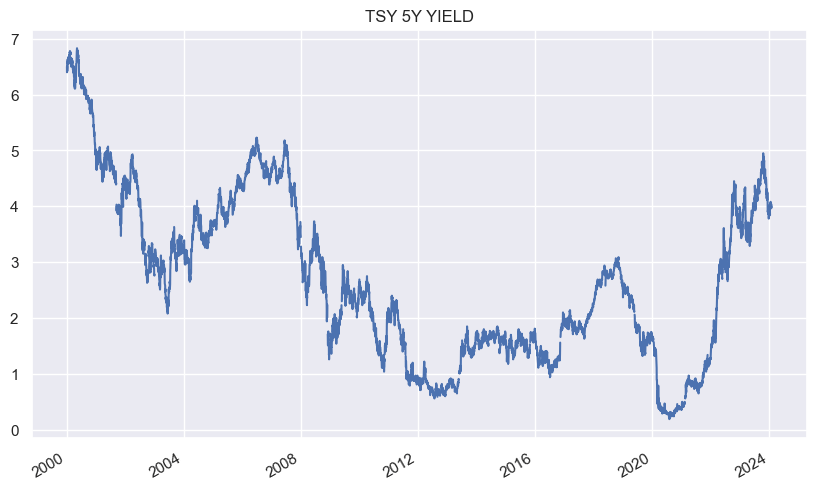
We can also look at the 5Y inflation-adjusted analogue or real yield and that looks even more elevated in relative terms. The real yield strips out the expected inflation over the next 5 years from the nominal rate, showing a kind of expected additional premium investors get over and above inflation. Overall, the level of interest rates, as proxied by the 5Y Treasury yield remains fairly attractive on both the nominal and real basis.
Systematic Income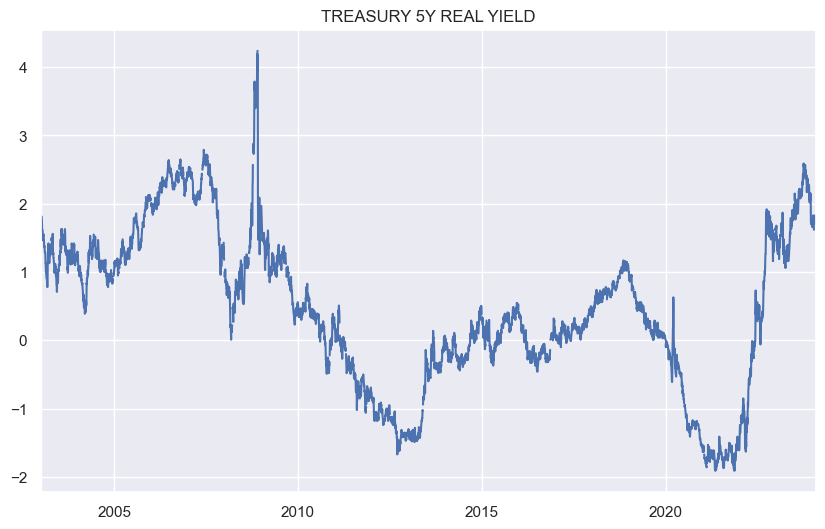
Turning to the yield curve – a proxy we prefer is the 3-month / 5-year Treasury yield differential. This is not far off record levels and around 2.5% more inverted than has been the historical average. In short, floating-rate securities that are anchored off short-term rates are generating around 1.4% more in base rates than longer-term fixed-rate securities, all else equal.
Systematic Income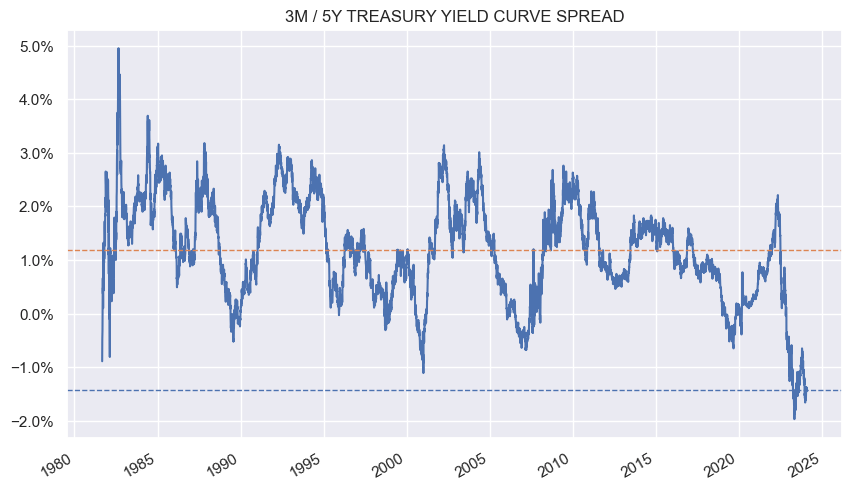
Clearly, much of this is due to the expectation that the Fed is going to take the policy rate lower over the coming years. The market expects the policy rate to move towards 3.3% by the end of 2025. This would renormalize the curve at around 0.6% – a bit below the 1.1% historic average, meaning the current 5Y Treasury yield of 3.91% would sit around 0.6% above the future expected short-term rate of 3.3%.
Systematic Income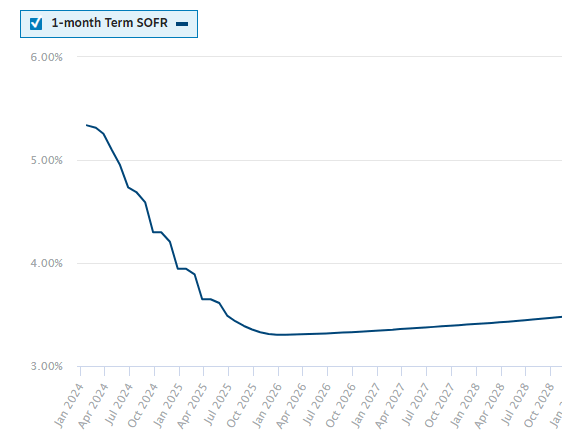
Overall, this suggests that while fixed-income allocations are fairly attractive overall, floating-rate securities especially so. Not only are they attractive relative to their longer-duration counterparts now but would likely remain so even if forward rate expectations are realized as the yield curve is expected to remain quite a bit flatter than its historical average.
Finally, let’s take a look at credit spreads, proxied by high-yield corporate bonds. Here we see that spreads are not far off a rockbottom level, making lower-quality credit assets not very appealing.
Systematic Income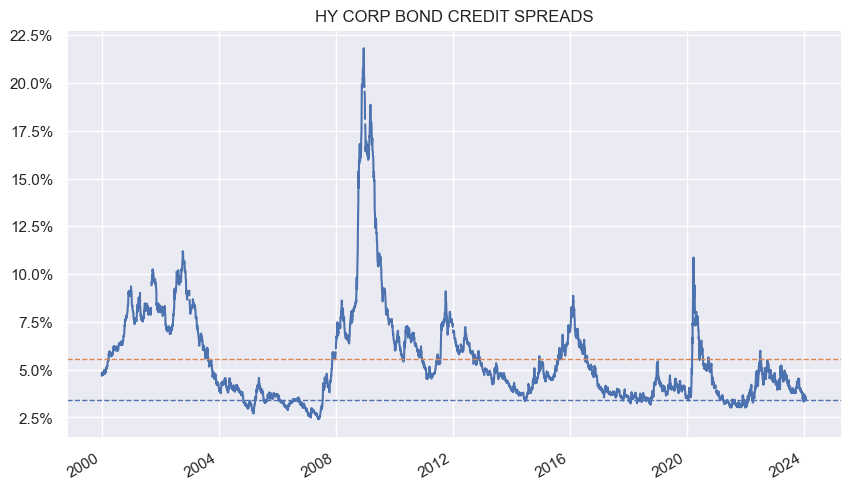
Another way to look at this is by disaggregating the yield of the average high-yield corporate bond into its “risk-free” i.e. Treasury yield portion and its “risky” or credit spread portion as shown below.
Systematic Income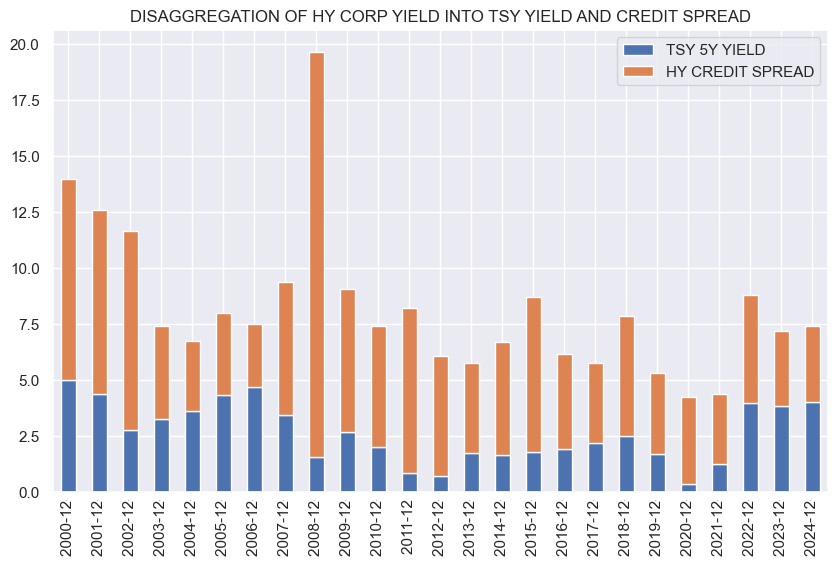
If we plot the level of credit spreads as a proportion of the overall credit yield we see that it is at the lowest level since 2008 and has only been lower prior to two recessions. This again highlights that lower-quality assets are not particularly compelling at the moment.
Systematic Income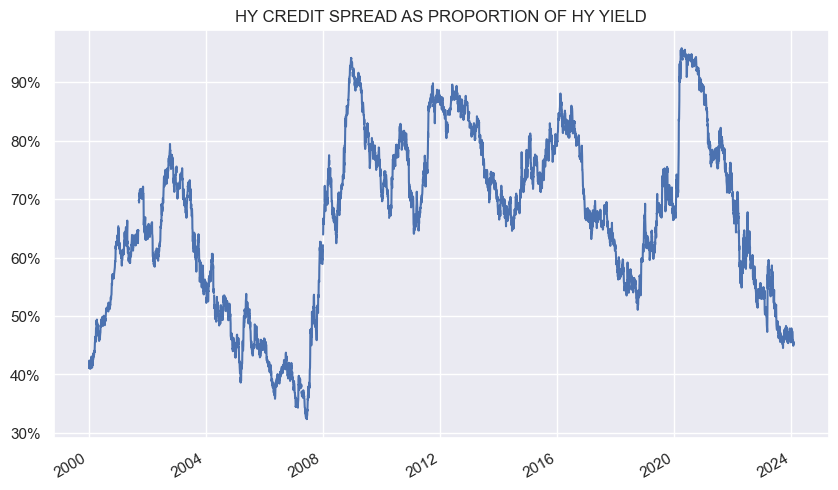
Key Micro Factors
Let’s now have a look at the micro factors. These factors are linked to structural features and pricing of CEFs themselves. They are also influenced by the macro factors discussed above.
As many investors know, CEFs tend to employ leverage which are based off short-term rates. The traditional leveraged fixed-coupon bond CEF has not been all that attractive because of the shape of the yield curve. This is because a fund that holds the average high-yield corporate bond at a 7.5% yield pays away around 6.25% on its leverage facility and another 1% in fund expenses, which leaves around 0.25% in net income for shareholders. In short, the typical leveraged fixed-rate CEFs generate little net income on their leveraged assets.
This is why we have tended to tilt to the few funds that either have fixed-rate leverage facilities or those that have interest rate hedges all of which came in handy when rates rose sharply in 2022. These funds include the Ares Dynamic Credit Allocation Fund (ARDC), the Cohen suite of preferred CEFs like LDP and PTA and some others.
As it happens, we rotated out of ARDC at the start of the year when its discount hit a low single-digit level which looked expensive to us. It has widened since then and we would look to leg back in on further weakness, particularly if credit spreads widen out.
Systematic Income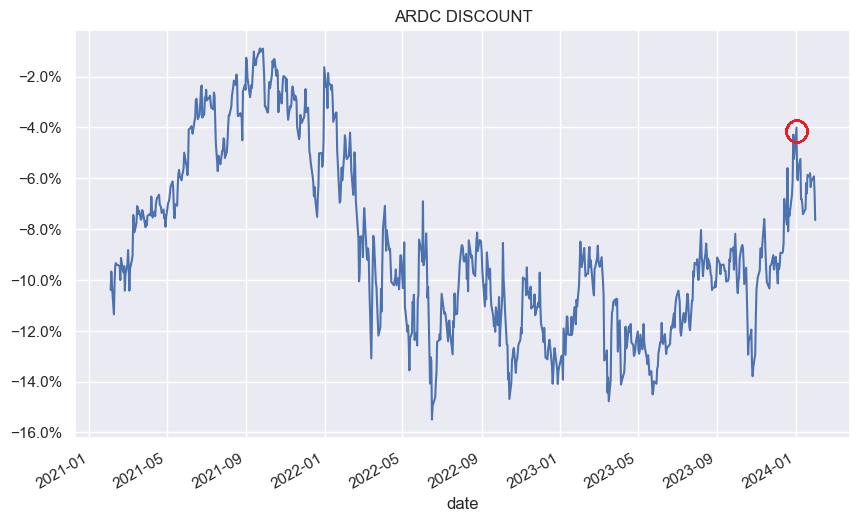
CEFs with floating-rate assets are at less of a disadvantage in this environment. Separately, unleveraged CEFs generate relatively efficient income as they don’t carry leverage and would tend to have smaller drawdowns on any market weakness. These can be particularly attractive right now for more risk-averse investors.
As far as the quality factor, we take our cue from the credit / rate breakdown discussed above. Risk-free rates make up a larger than usual proportion of the overall credit yield and lower-quality assets are not compensated a whole lot right now. Moreover, it’s important to remember that lower-quality assets tend to sell off more than higher-quality assets during drawdowns. All of this suggests that a higher-quality allocation makes a lot of sense.
This doesn’t mean shunning any kind of risk but it does suggest that stretching for yield in today’s environment is unlikely to be a winning strategy. Stretching for yield may feel comfortable because a number of macro risks appear to have dissipated, however, markets can turn very quickly as we saw in early 2022. A higher-quality allocation is much more likely to remain resilient, allowing investors to put money in downbeat higher-yielding assets during drawdowns. This anticyclical strategy of buying low (i.e. buying higher-yielding assets during drawdowns) and selling high (i.e. buying higher-quality assets during rallies) is much more likely to generate stronger portfolio wealth through-the-cycle.
For this reason we are avoiding highly-leveraged funds with a significant allocation to low-rating buckets like CCC and single-B.
Finally, on the discount front, the broad CEF picture is pretty compelling. The average CEF sector discount is around 7% which is about 2% wider than the average this century.
Systematic Income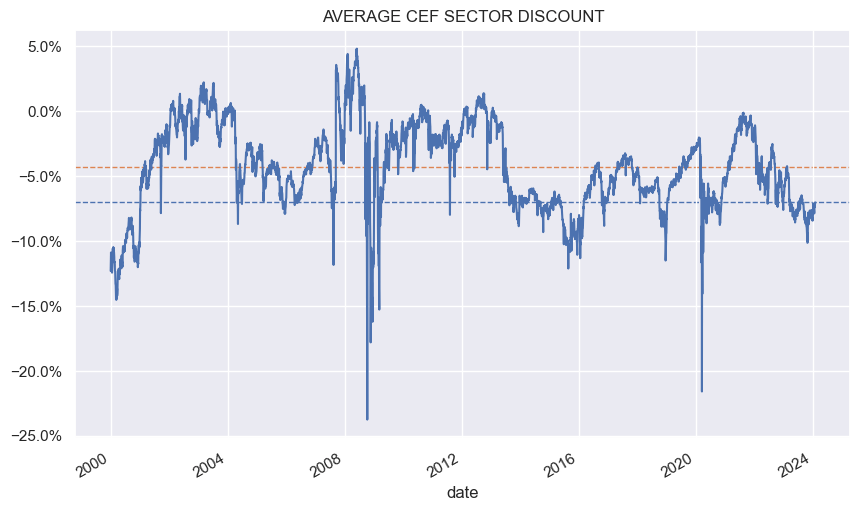
To drill into individual sectors we can check the following chart. The y-axis shows the discount while the x-axis shows the 5-year discount percentile, indicating the sector’s relative history (a zero level means the sector discount is at the widest level of the last 5 years).
Systematic Income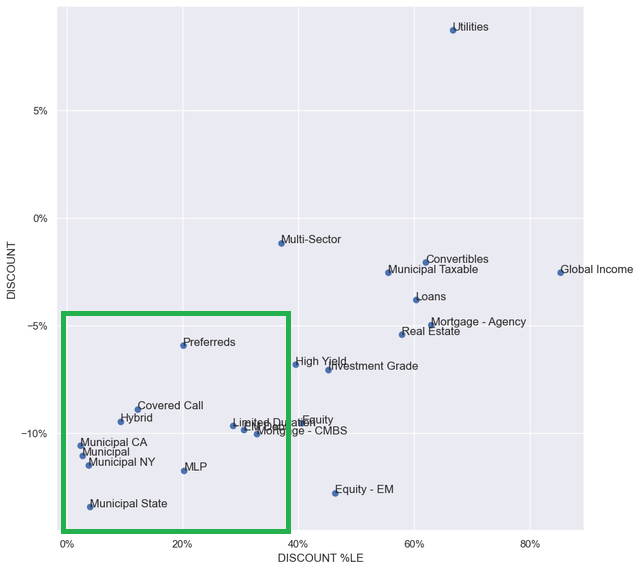
We see that Munis remain at depressed valuations. They are joined by MLPs, Hybrid and Covered Call CEFs. The preferreds sector is bifurcated with most funds trading at steep discount, offset by a number of John Hancock funds which are expensive.
Takeaways And Some Ideas
Judging by the indicators discussed above, the CEF picture is mixed. While the overall level of interest rates is fairly high, credit spreads are tight and the yield curve is inverted. This environment favors higher-quality floating-rate / shorter-duration sectors. Unfortunately, there are not many of those however they do include higher-quality securitized assets and CLO debt plus shorter-duration securities.
The funds that we like here are those like the Nuveen Mortgage and Income Fund (JLS), trading at a 13% discount and a 10.1% yield and the Western Asset Mortgage Opportunity Fund (DMO), trading at a 7.4% discount and a 12.7% yield.
We also continue to like preferreds which feature a modest duration (as nearly all institutional preferreds max out at a 5-year duration due to the Fix/Float feature) and a relatively high quality profile. Here, funds like the Flaherty & Crumrine Preferred and Income Opportunity Fund (PFO), trading at a 11.7% discount and a 6.55% yield and the Cohen & Steers Limited Duration Preferred and Income Fund (LDP), trading at a 6.9% discount and a 8.53% yield. The Cohen preferreds have hedged out much of the expensive leverage cost that other funds face.
Muni CEFs look reasonably attractive as well. Unlike the taxable yield curve (i.e. the Treasury yield curve), the tax-exempt curve remains “normal” or upwardly sloping though not by much.
UBS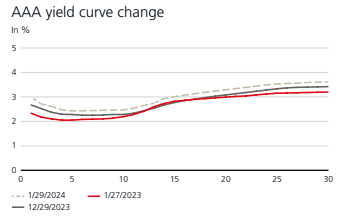
That said, leverage costs are large enough so that these funds will struggle to generate much net income on their leveraged assets. For this reason, low / no-leverage CEFs like the Nuveen AMT-Free Municipal Value Fund (NUW), trading at a 9.3% discount and a 3.64% yield or the BlackRock 2037 Municipal Target Term Trust (BMN), trading at a 6.7% discount and a 4.6% yield are worth a look, among others.
In our view, rather than chasing “hot” funds or allocating procyclically by stretching for yield in calm markets, investors are more likely to achieve their goals by focusing on a handful of macro and micro factors in their CEF allocation. This approach currently favors shorter-duration higher-quality funds with modest or hedged-out leverage in sectors that are historically cheap.

 Q2 2024 Earnings Call Transcript")

