
Yuichiro Chino/Moment via Getty Images
The arena of ETFs targeting hot themes like breakthrough technology, which I have been discussing in a series of articles, became somewhat crowded in the late 2010s, and especially during the pandemic, as managers were all agog to capitalize on unstoppably ballooning U.S. tech valuations. The euphoria calmed during the 2022 bear market as a moment of reckoning driven by rapidly rising interest rates amid soaring oil prices and persistent inflation arrived, hitting long-duration names hard. Nevertheless, as the resilient economy and inflation trending down opened the door for a hypothesis that doves would finally prevail in 2024, with an AI ingredient also contributing, the clobbered innovation ETF universe staged a massive recovery. In this regard, the launch of the JPMorgan U.S. Tech Leaders ETF (NASDAQ:JTEK), which was announced in March 2023 but ultimately happened in October, had almost perfect timing. JTEK has seen a remarkable rise in the ensuing months, even beating the Invesco QQQ Trust ETF (QQQ), let alone the iShares Core S&P 500 ETF (IVV).
However, as my dear long-term readers certainly know, I am not content with simplistic extrapolations of short-term performance. This is a sophomoric approach that can lead to dismal results if an investment decision is made solely based on it. In this regard, let us address the most important points in the note using factor data as an essential ingredient.
JTEK strategy: favoring tech and tech-enabled worthies
JTEK is managed actively, with the core principles of its stock selection approach outlined in the summary prospectus. In short, it is said that it
will invest primarily in equity securities issued by technology and technology-enabled companies which the adviser believes are leaders and where the magnitude and/or duration of future growth for these companies is underappreciated by the market.
In the document, it is also clarified that during the investment process, to assess whether a company is a tech (or tech-enabled) leader or not, the adviser takes into account a few parameters, including the following: “a disruptive business model, a unique sustainable competitive advantage, a large addressable market, a proven management team.”
Regarding the size factor, it is said that JTEK “will invest primarily in common stocks of companies across all market capitalizations.” However, my analysis showed that as of February 6, the fund had just around 3.5% allocation to SMID stocks, while mega-caps, together with a few trillion-dollar names, accounted for more than half of its net assets, resulting in a weighted-average market cap of roughly $441 billion.
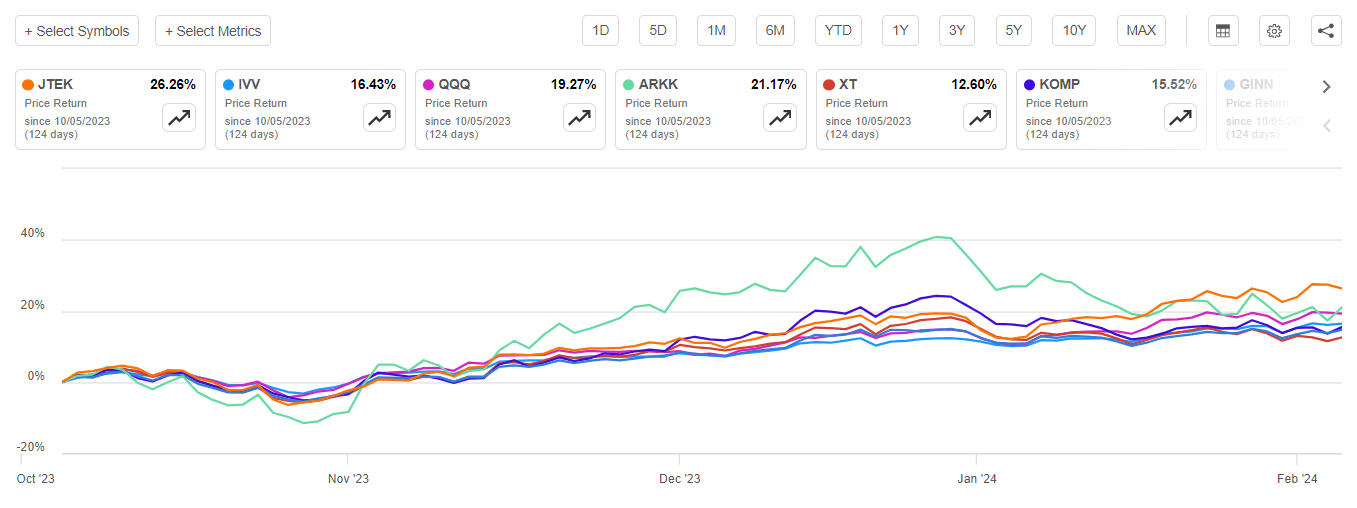
JTEK soared amid growth rotation, beating the market and a few peers
Incepted in October 2023, JTEK has had a fantastic run, beating both IVV and QQQ, as well as its four largest (regarding AUM) peers, namely the ARK Innovation ETF (ARKK), the iShares Exponential Technologies ETF (XT), the SPDR S&P Kensho New Economies Composite ETF (KOMP), and the Goldman Sachs Innovate Equity ETF (GINN), partly thanks to the growth rotation.
Seeking Alpha
However, its robust performance cannot be explained solely by the new market climate favoring longer-duration equities. The issue here is that in 2024, it has also beaten almost all the funds on my ‘innovation’ ETF list, including a few funds I covered in the past. More specifically, JTEK has delivered a 6.87% price return, which is on par with the return of the AB Disruptors ETF (FWD), a vehicle I discussed in June 2023. The other 15 funds have had weaker results, from the First Trust Innovation Leaders ETF’s (ILDR) 6.08% to ARKK’s dismal 10.83% decline.
| Fund | 1M Perf | YTD Perf |
| JTEK | 11.93% | 6.87% |
| FWD | 11.47% | 6.87% |
| BlackRock Future Tech ETF (BTEK) | 9.28% | 3.21% |
| ILDR | 9.18% | 6.08% |
| Harbor Disruptive Innovation ETF (INNO) | 8.12% | 4.30% |
| SPDR FactSet Innovative Technology ETF (XITK) | 7.32% | 0.70% |
| Innovator Deepwater Frontier Tech ETF (LOUP) | 6.45% | 0.08% |
| Goldman Sachs Future Tech Leaders Equity ETF (GTEK) | 5.44% | 0.44% |
| WisdomTree Artificial Intelligence and Innovation Fund ETF (WTAI) | 4.73% | -1.55% |
| GINN | 3.48% | 0.42% |
| ALPS Disruptive Technologies ETF (DTEC) | 2.52% | -2.18% |
| Main Thematic Innovation ETF (TMAT) | 1.48% | -3.91% |
| XT | 0.66% | -3.86% |
| KOMP | -0.16% | -5.03% |
| Direxion Moonshot Innovators ETF (MOON) | -1.49% | -9.10% |
| SPDR Kensho Final Frontiers ETF (ROKT) | -1.59% | -4.81% |
| ARKK | -4.50% | -10.83% |
Data from Seeking Alpha (as of February 7)
So it seems that not only the new prevailing narrative but also stock selection and weighting supported by managers’ expertise were behind its solid run.
JTEK delivers a spectacular growth factor story
If my dear readers ask me what JTEK is in one sentence, I would answer that this is a growth-at-all-costs ETF. In fact, it is a textbook example of a purely value-agnostic portfolio that is heavy in growth stocks. More specifically, among the 60 companies JTEK had in its software industry-heavy (32.2%) portfolio as of February 6, 26 had a forward revenue growth rate above 20%, with the top name being Nu Holdings (NU), a São Paulo-based LatAm bank with a striking 85% growth rate. Most names in this group are from the software and semiconductor & semiconductor equipment industries, with NVIDIA (NVDA) also on this list. Besides, about 54% have a 3-year revenue compound annual growth rate above 20%, which means they were likely capable of sustaining rapid sales expansion during the period of capital scarcity driven by higher interest rates, which is worth respecting. To give a bit more color, below is the scatter plot combining these parameters.
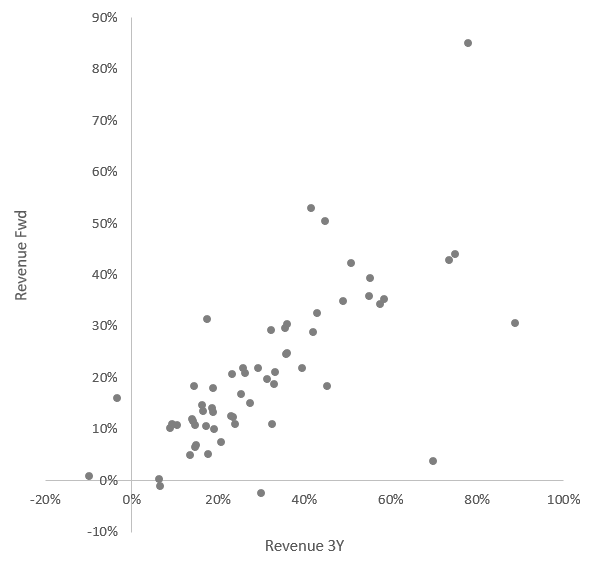
Created by the author using data from Seeking Alpha and the fund
Next, below are the weighted-average figures that reinforce the point that JTEK’s portfolio has outstanding growth characteristics:
| Metric | JTEK (holdings as of February 6) |
| EPS Fwd | 29.69% |
| Revenue Fwd | 20.97% |
| Revenue 3Y CAGR | 28.60% |
Calculated using data from Seeking Alpha and the fund
For context, QQQ has a forward revenue growth rate of only about 12% (as of February 5). Besides, what is unquestionably impressive is that more than 87% of JTEK’s holdings have a Seeking Alpha Quant Growth grade of B- or higher, with those in the elite A (+ and -) league accounting for close to 56%. This is one of the highest results among the ETFs I have analyzed to date.
JTEK’s vulnerability: potential over-appreciation reflected in multiples
But growth stories always have a price. At times, an exorbitant one. Let us elaborate on that.
First, my calculations show its weighted-average earnings yield at only 83 bps. It is meaningless as it is distorted by the triple-digit P/Es that names like The Trade Desk (TTD) have. A more reliable metric is Price/Sales, which is at 12.5x. QQQ has a 9.4x ratio. Second, 95% of the holdings have a Quant Valuation rating of D+ or lower. I suppose it is impossible to prove this portfolio is not generously priced.
JTEK quality considerations: surprisingly resilient balance sheets
In fairness, I was impressed by JTEK’s quality exposure. Especially the relative soundness of the financial positions of most firms present.
More specifically, as my calculations illustrated, among 45 of its holdings with positive EBITDA, only 7 have had an uncomfortable Net Debt/EBITDA ratio above 3x. 11 companies have had that ratio (sometimes referred to as ‘leverage’) at 2x and lower, while 27 (close to half of net assets) had a negative net debt resulting from a massive cash pile that covered it excessively. Less than 20% have Debt/Equity above 100%.
Next, its WA Return on Assets looks healthy at 7% (of course, by growth echelon standards; for cheaper companies, I would prefer at least 10%). Ultimately, the share of firms with a B- Quant Profitability grade or higher is over 83%, which is a nice result.
Is it worth buying into JTEK?
JTEK has had a solid run since its inception, which raises the question of whether it is worth buying into this momentum play or remaining on the sidelines until a more pronounced pullback. An answer here should be that it depends on an investor’s style factor preferences. JTEK is an option for investors who are ready to pay whatever price for outstanding growth (predominantly sales) stories. While also appealing from a quality standpoint, I believe JTEK is a pass for my dear readers who are more into GARP strategies; it goes without saying that this is not a vehicle for value investors. There is another issue: the expense ratio of 65 bps. This is not a wafer-thin figure. JTEK has just a few months in the books amid the growth rotation, and we certainly cannot say for sure whether it will be capable of sustaining outsized returns going forward. In this regard, I would opt for a more conservative Hold rating this time.

 Q2 2024 Earnings Call Transcript")

