
Vithun Khamsong/Moment via Getty Images
Enbridge (NYSE:ENB) and Enterprise Products Partners (NYSE:EPD) are both well-known infrastructure players in the conventional energy space. Their focus is mostly in the mid-stream segment, which brings stable and predictable revenues. The contracts are usually underpinned by healthy and established bodies that help de-risk the top-line even further.
When it comes to the balance sheet, both ENB and EPD are safe and can clearly access chep and flexible financing due to the healthy leverage and coverage metrics.
The combination of stable revenue component and strong financial profile, allows these two companies to accommodate truly attractive yield-levels that should satisfy most dividend-seeking investors.
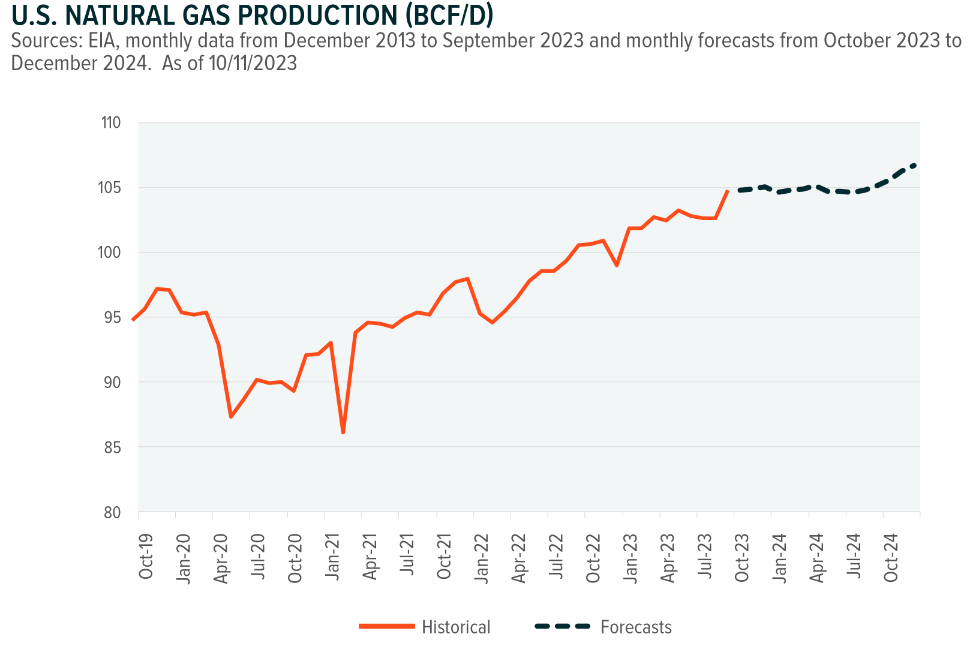
Moreover, the economic outlook for Enbridge and Enterprise Products Partners is bright. One of the key drivers for the midstream infrastructure is the flow and production of natural gas, which is projected to not only remain at the current levels, which are already favorable, but also to continue advancing higher throughout 2024.
Global X Management Company
Finally, as these businesses are per definition capital-intensive that requires to frequently tap into the financing markets, the fact that SOFR is projected to decrease should provide additional boost here.
With that being said, let’s explore these two companies in a bit more detail and determine, which one of these are set to deliver more enticing returns going forward. Both are great, but one is better if we look at the nature of cash flows, balance sheets and valuations.
Enbridge has more diversified and defensive cash flows
Enbridge and Enterprise Products Partners operate mainly across the following segments:
- Liquid pipelines
- Natural gas pipelines
- Gas utilities and storage
As a result, the lion’s share of revenues are fee based and contracted against “cost of service” type of agreements. This introduces fixed-income like dynamics, which allows to easier plan future CapEx spend, capital allocation in the M&A front, and, most importantly, facilitate stable dividends.
In ENB’s case, 98% of EBITDA stems from these “cost of service” contracts, while for EPD the relevant share is circa 77%.
An additional advantage for ENB is the Company’s presence in the renewable energy segment that injects diversity in the overall revenue mix. For Enterprise Products Partners there are no material capital allocations in this space.
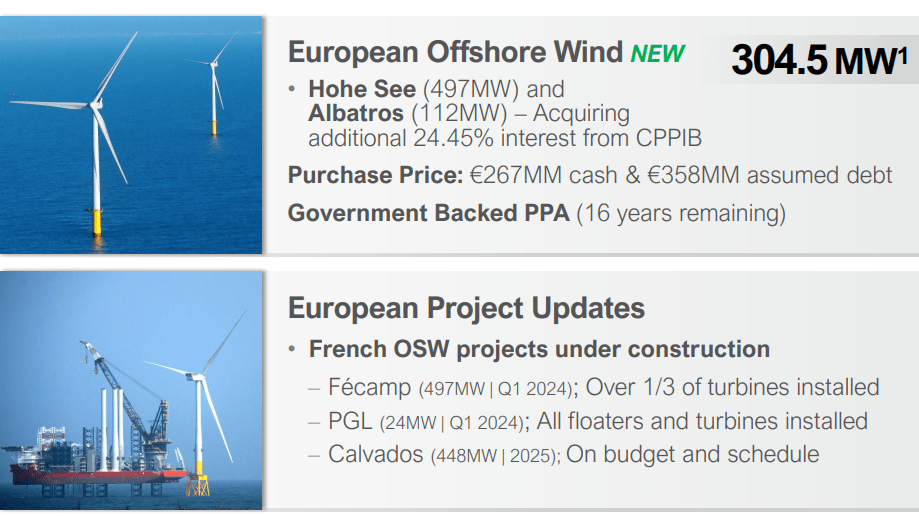
So, if we look at ENB’s renewable energy portfolio, most of these assets are associated with offshore wind that offers uncorrelated exposure to the key segments around midstream verticals.
ENB Investor Presentation
Currently, 3 of 4 offshore projects are with already signed PPAs (which essentially provide the same level of revenue stability as the other assets) or very close to landing at their CODs (commercial operation dates).
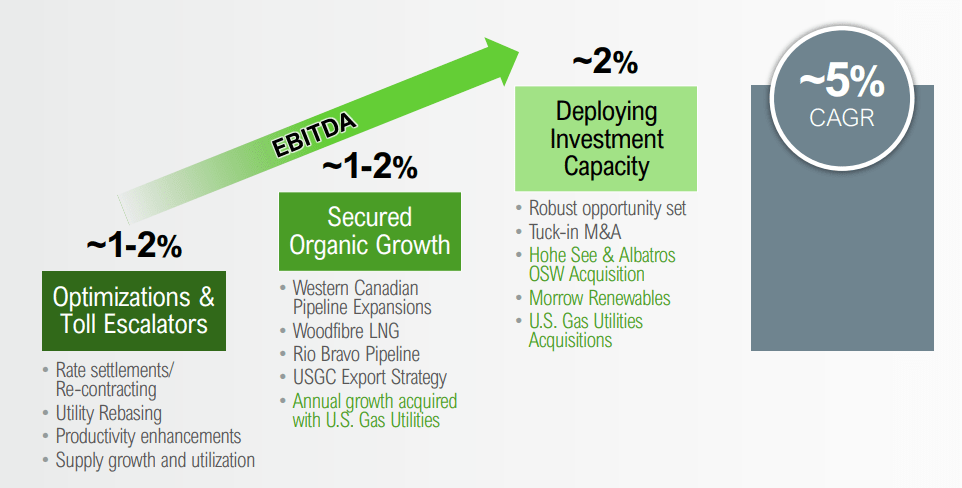
Looking forward at the medium-term horizon, ENB’s EBITDA is projected to advance by ~5% CAGR, where about half is explained from embedded escalators (e.g., ~80% of EBITDA is inflation-protected) and organic growth opportunities, and the other half from M&A and renewables.
ENB Investor Presentation
At the EPS level, Enterprise Products Partners are set to advance at quite similar fashion over the next 3 year period.
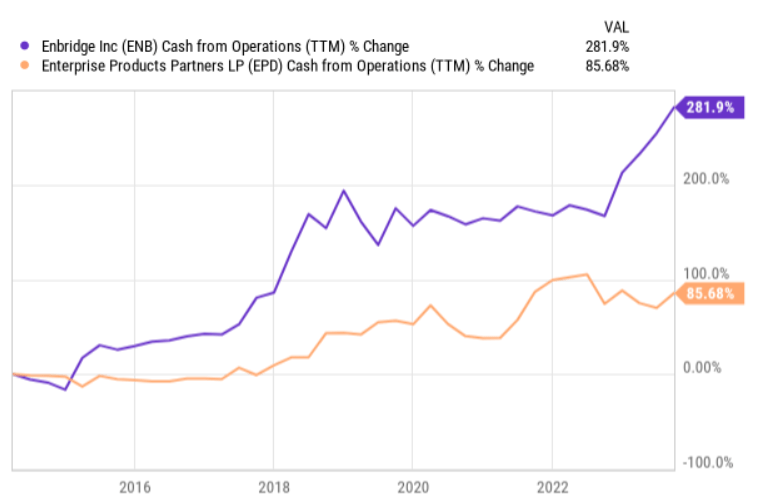
However, when it comes to the underlying cash conversion and growth in the cash generation aspect, Enbridge has registered way greater results than Enterprise Products Partners.
Ycharts
Granted, some of this is explained by the movement in the inventory and there are effects from the external growth channel, but, at the core, ENB has clearly delivered more improved cash flows to its investor base relative to EPD.
Finally, we have to also appreciate the fact that Enbridge generates roughly 18% more in EBITDA (TTM) than Enterprise Products Partners, which in turn renders stronger basis from which to diversify revenue sources and fund organic growth opportunities.
Enterprise Products Partners has stronger financial risk profile
While at the cash generation front both companies are indeed relatively similar with some slight advantages for Enbridge, when it comes the balance sheet and the overall financial risk, Enterprise Products Partners takes the lead here.
First, EPD carries an upper-investment grade credit rating, which is not only one notch higher than for ENB, but also a relative exception in the entire midstream, MLP segment. In practice, it takes quite of an effort to transition from BBB+ (the case of ENB) to A- (the case of EPD). This is not only a testament of EPD’s robust financial profile, but also an enabler for the Company to access cheaper financing at more flexible terms.
Second, Enterprise Products Partners has more favorable structure of debt maturities. Both companies have attracted rather long-dated financing proceeds, where majority of these are based on fixed rates below the current market levels, but in EPD’s case the near-term maturity profile is just better.
As we can see in the graph below, EPD has about ~$1 billion of debt to refinance in 2024 and 2025, which together account for less than 7% of the total outstanding borrowings.
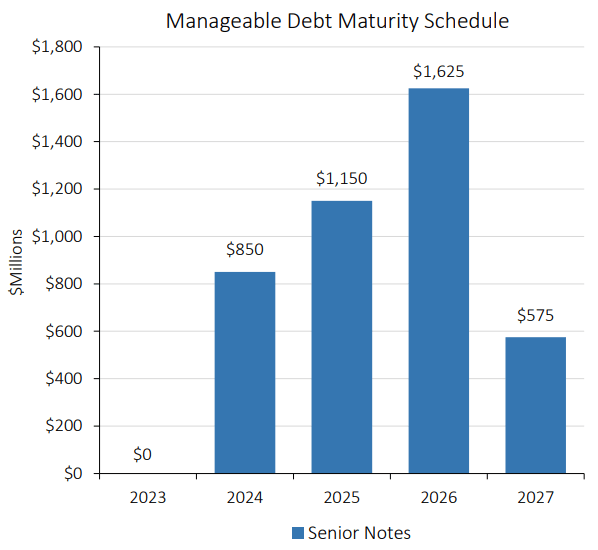
EPD Investor Presentation
Yet, for Enbridge the corresponding annual figure over 2024 and 2025 lands at ~$6 billion, which in turn constitutes ~25% of the total interest bearing debt portfolio.
In practical terms, this means that in the next couple of years EPD will be able to avoid notable refinancing risk and keep the currently “locked-in, below market level” financing for longer period of time.
Finally, when speaking about the financial risk, we have to factor in the future CapEx spend that in ENB’s case is rather astronomical. The table below highlights that there is roughly $21 billion of organic CapEx program to complete over the next several years.
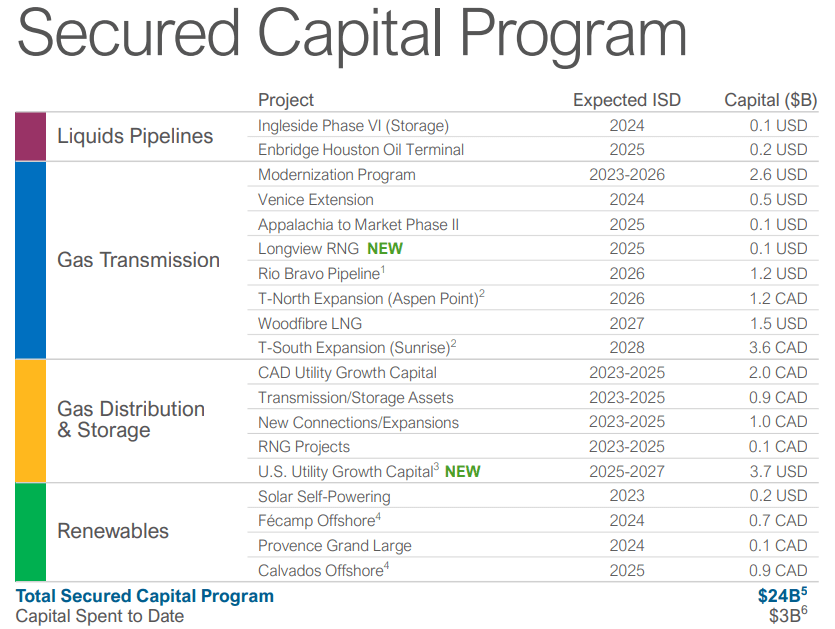
ENB Investor Presentation
This is massive and clearly will require Enbridge to assume sizeable debt proceeds (during an environment of elevated SOFR) even with its cash flow retention of 40%.
For Enterprise Products Partners, however, the near-term CapEx plan is way more balanced, indicating less of a reliance to incremental debt.
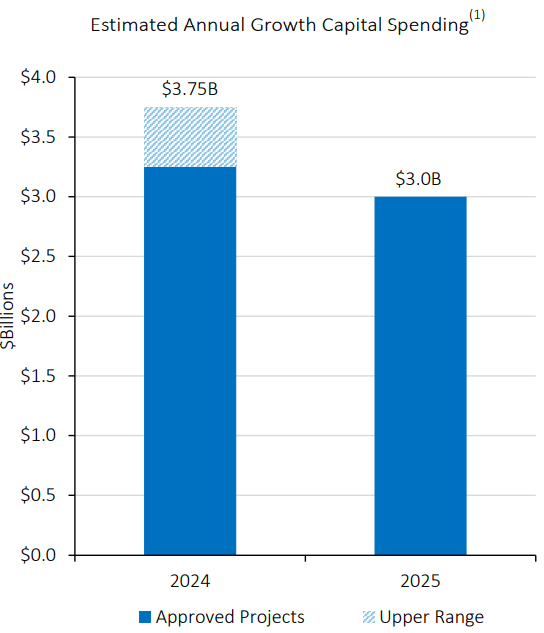
4Q 2023 EPD Earnings Slides
In a nutshell, from the financial risk perspective, EPD is better positioned across the key areas that matter: higher credit rating, more back-end loaded debt maturities and lower financial pressure from the committed CapEx plans.
Valuations make the choice easy
Given the relative homogeneity in the top-line, but significantly more balanced financial risk exposure for EPD, one would expect higher dividend yield and maybe lower valuations for ENB.
Yet, as of now, both companies offer similar dividend yield levels at 7.4 – 7.7% (i.e., the difference is really just ~30 basis points). The TTM cash flow payout ratio for EPD is 50%, while for ENB it stands at 60%. Again, better for EPD.
Similarly, if we look at the key valuation metrics, Enterprise Products Partners pop out as more attractive investment case yet again: (comparing TTM multiples of EPD vs ENB)
- EV/EBITDA of 10.03x vs 13.4x
- P/E of 10.51x vs 17.06x
- P/S (price to sales) of 1.18x vs 2.13x
The bottom line
There are pros and cons for both of these companies, but putting it all together and contextualizing it with the prevailing valuations, Enterprise Products Partners sticks out as a superior investment case.
The key advantage for Enbridge is that it carries a bit more diversified top-line in combination with larger share of the EBITDA stemming from contracted (regulated) sales channels. However, Enterprise Products Partners also embodies these characteristics (albeit at lesser degree), and at the same time offers much stronger financial profile and more enticing multiples.
As a result, I am recommending to go long Enterprise Products Partners L.P., while keeping Enbridge Inc. at hold mostly due to the higher valuations and risks that are associated with extra leverage that could come from its considerable CapEx program.

 Q2 2024 Earnings Call Transcript")

