HUNG CHIN LIU/iStock via Getty Images
Thesis
In this article, I will evaluate ASML Holding N.V. (NASDAQ:ASML) to ascertain its estimated fair price and gauge its investment potential. Upon employing two models, I have determined that the stock offers an upside ranging from 13.4% to 29.6%, with potential annual returns spanning from 16.8% to 21.5%. The sole identified risk pertains to the semiconductor cycle, which is speculated to have already bottomed out. Consequently, I rate ASML stock as a strong buy.
Overview
ASML (Advanced Semiconductor Materials Lithography) as its name suggests , does not manufacture semiconductors; rather, it specializes in producing the equipment necessary for semiconductor manufacturing. Among its product offerings are EUV & DUV lithography systems, refurbished systems, metrology & inspection systems, and computational lithography.
Lithography involves creating patterns on silicon wafers or other materials. DUV lithography operates with processes of 7nm and larger, while EUV is tailored for processes of 2nm and smaller. DUV technology encompasses variations such as Krypton Fluoride [KrF], Argon Fluoride [ArF], and Argon Fluoride Inversion [KrFi]. Additionally, EUV relies on mirrors, whereas DUV utilizes lenses to direct ultraviolet light.
ASML Q4 2023 Investors’ Presentation
The semiconductor lithography equipment market is projected to grow at a rate of 7.38% until 2029. However, this modest growth rate is a result of averaging EUV and DUV growth rates within the same market, which substantially masks the higher growth potential of EUV. I have calculated a CAGR of 23.15% for EUV until 2028 based on the average suggested by four distinct sources: GlobalNewswire, Verified Market Research, PR Newswire and Research and Markets
Author’s Calculation with base on Mordor Intelligence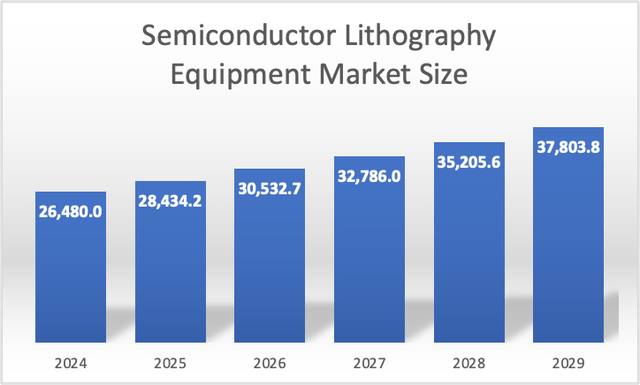
Metrology inspection systems ensure that devices meet the desired properties. The Semiconductor Metrology and Inspection System market is anticipated to grow at a CAGR of 5.2% until 2029.
Author’s Calculation with base on Mordor Intelligence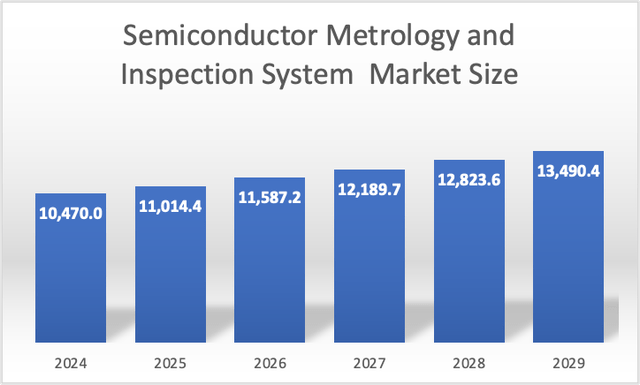
Finally, computational lithography involves simulating chip designs on computers to emulate lithography processes (EUV or DUV) using data collected from real processes.
Financials
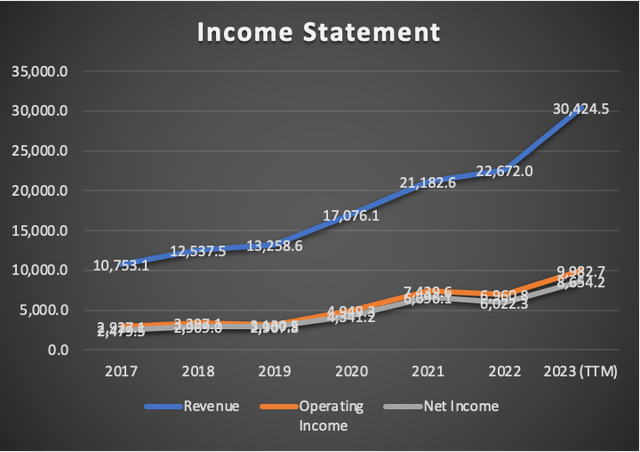
ASML has experienced robust revenue growth, averaging an impressive annual pace of 30.5%. Operating income has surged even faster, boasting a growth rate of 40.2%, while net income has shown slightly swifter growth at 41.5%.
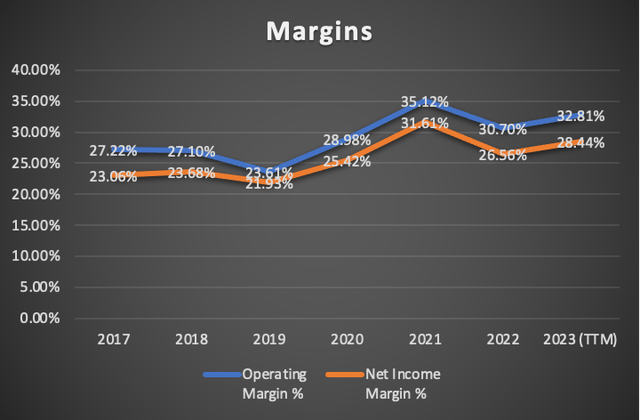
Though margins have not reached their all-time highs, they remain notably strong, standing at 32.81% and 28.44% respectively.
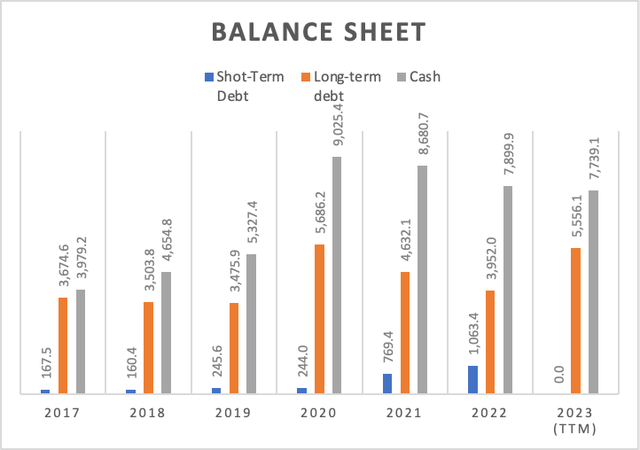
ASML’s financial position exhibits a favorable trend, with more cash than debt consistently maintained from 2017 to 2023. While average debt growth during this period was 7.4%, cash grew nearly twice as fast at 15.7%.
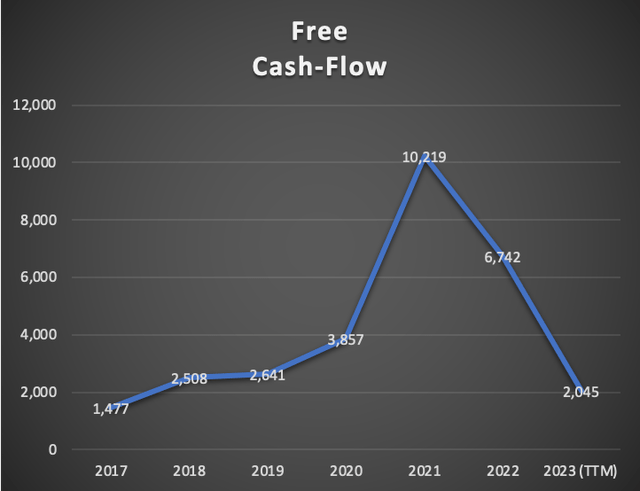
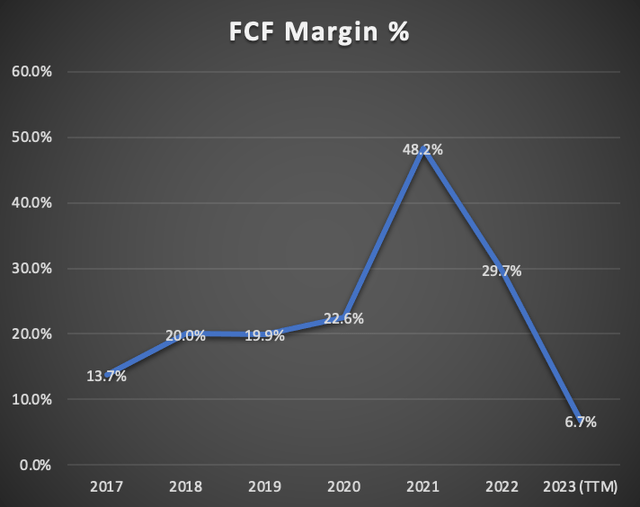
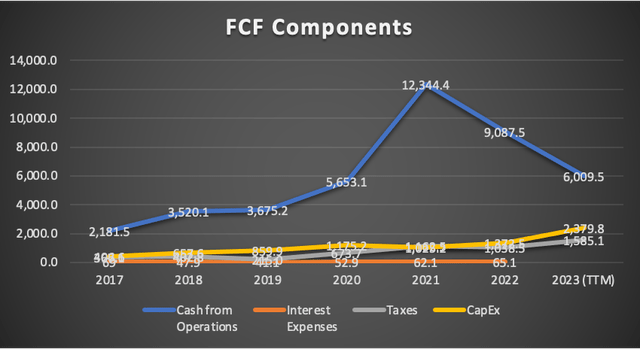
However, the trajectory of free cash flow presents a somewhat gloomier picture. ASML peaked in free cash flow production in 2021, generating $10.2 billion. Since then, free cash flow generation has dwindled to $2.04 billion.
This decline is also evident in the free cash flow margin, currently resting at 6.4%, a significant drop from the 2021 peak of 48.2%. The decrease can be attributed to reduced operating cash flows coupled with a nearly twofold increase in CapEx, which has surged to $1.02 billion compared to 2021.
Valuation
In this valuation, I will employ two models. The first model will be based on Analysts’ Estimates for revenue and EPS, while the second model will be crafted using my own estimates.
Outlined in the table below are all the current financial data for ASML required for calculating the WACC. It’s notable that CapEx, D&A, and interest expenses will be projected using margins tied to revenue.
| TABLE OF ASSUMPTIONS | |
| (Current data) | |
| Assumptions Part 1 | |
| Equity Value | 14,851.30 |
| Debt Value | 5,556.10 |
| Cost of Debt | 0.00% |
| Tax Rate | 15.48% |
| 10y Treasury | 4.14% |
| Beta | 1.38 |
| Market Return | 10.50% |
| Cost of Equity | 12.92% |
| Assumptions Part 2 | |
| CapEx | 2,379.80 |
| Capex Margin | 7.82% |
| Net Income | 8,654.20 |
| Interest | 0.00 |
| Tax | 1,585.10 |
| D&A | 816.70 |
| Ebitda | 11,056.00 |
| D&A Margin | 2.68% |
| Interest Expense Margin | 0.00% |
| Revenue | 30,424.5 |
Analysts’ Estimates
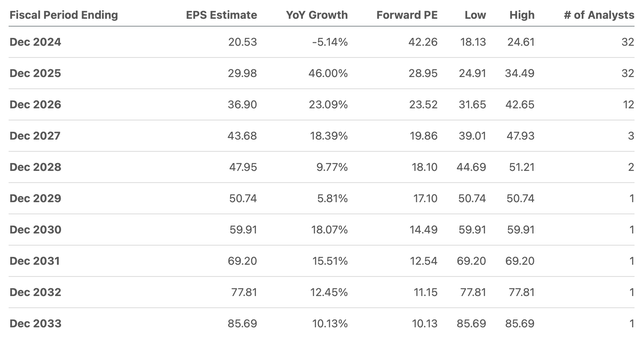
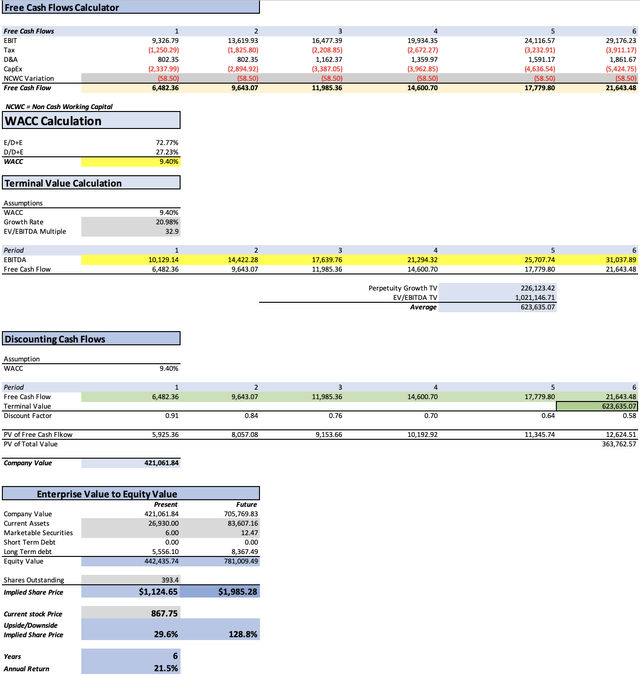
As mentioned earlier, the first model is based on current analysts’ estimates. Beginning with EPS, it’s evident that the available estimates project EPS to reach $36.90 by 2026, marking a remarkable 79% growth from the expected EPS of $20.53 in 2024. The estimates extend up to 2033, with a lone projection suggesting that EPS could soar to $85.69, nearly quadrupling the 2024 estimate. However, I will not consider estimates beyond 2026 due to limited analyst coverage. Instead, I will focus on estimates for 2024 and 2025, disregarding 2026 despite approximately 12 analysts providing projections.
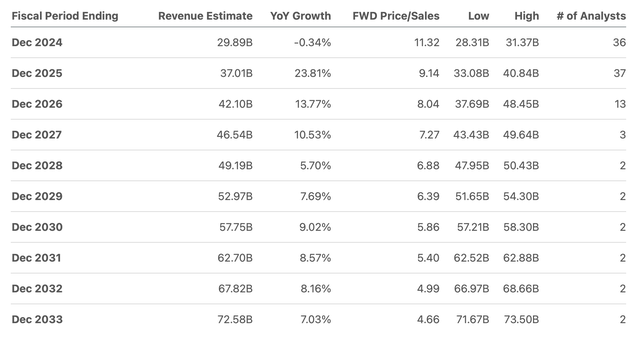
In contrast, revenue is anticipated to exhibit slower annual growth compared to EPS. Projections indicate that revenue for 2026 will reach $42.10 billion, reflecting a 40% increase from 2024. By 2033, estimates suggest revenue could soar to $72.58 billion, more than double the 2024 expectation.
Finally, for revenue beyond 2025, I will use the forward revenue growth rate which stands at 17%, and for net income beyond 2025, I will use the 3-5y long-term EPS growth rate of around 20.98%.
| Revenue | Net Income | Plus Taxes | Plus D&A | Plus Interest | |
| 2024 | $29,890.0 | $8,076.50 | $9,326.79 | $10,129.14 | $10,129.14 |
| 2025 | $37,010.0 | $11,794.13 | $13,619.93 | $14,422.28 | $14,422.28 |
| 2026 | $43,301.7 | $14,268.54 | $16,477.39 | $17,639.76 | $17,639.76 |
| 2027 | $50,663.0 | $17,262.08 | $19,934.35 | $21,294.32 | $21,294.32 |
| 2028 | $59,275.7 | $20,883.67 | $24,116.57 | $25,707.74 | $25,707.74 |
| 2029 | $69,352.6 | $25,265.06 | $29,176.23 | $31,037.89 | $31,037.89 |
| ^Final EBITA^ |
| Net Income Margin | |
| 2024 | 27.02% |
| 2025 | 31.87% |
| 2026 | 32.95% |
| 2027 | 34.07% |
| 2028 | 35.23% |
| 2029 | 36.43% |
Based on the available estimates, the model suggests the stock has an upside potential of approximately 29.6%, indicating a fair price of around $1124.65. By 2029, the stock is projected to be valued at approximately $1985.28, translating into annual returns of 21.5% throughout the period.
If I were to incorporate the revenue and EPS projections for 2026, which I previously mentioned I would exclude, the fair price would increase to $1142.70, with a future price of $2015.70. This adjustment results in an increased upside of 31.7%, representing a 2.1% increment, and annual returns of 22%.
| Revenue | Net Income | Plus Taxes | Plus D&A | Plus Interest | |
| 2024 | $29,890.0 | $8,076.50 | $9,326.79 | $10,129.14 | $10,129.14 |
| 2025 | $37,010.0 | $11,794.13 | $13,619.93 | $14,422.28 | $14,422.28 |
| 2026 | $42,100.0 | $14,516.46 | $16,763.69 | $17,893.80 | $17,893.80 |
| 2027 | $49,257.0 | $17,562.01 | $20,280.71 | $21,602.94 | $21,602.94 |
| 2028 | $57,630.7 | $21,246.52 | $24,535.60 | $26,082.61 | $26,082.61 |
| 2029 | $67,427.9 | $25,704.04 | $29,683.17 | $31,493.17 | $31,493.17 |
| ^Final EBITA^ |
My Estimates
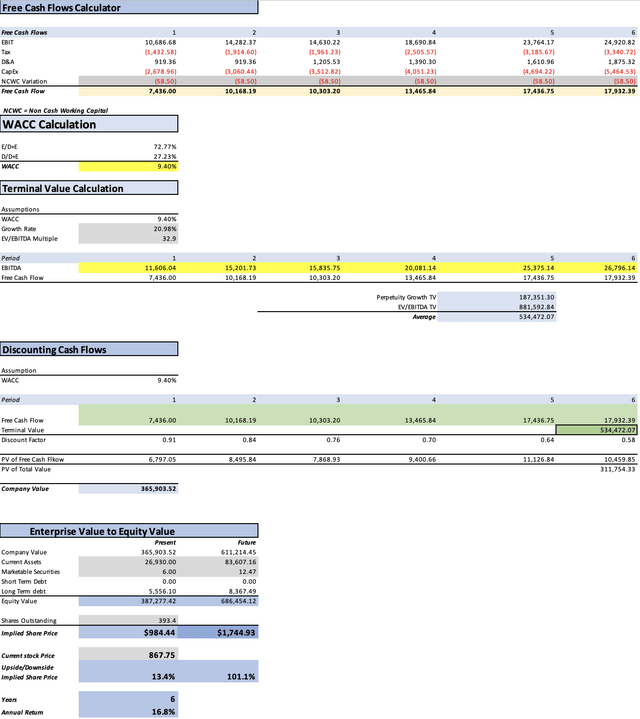
In this second model, I will project the potential revenue and net income of ASML by forecasting EUV, DUV, and Metrology based on their respective expected market growth rates.
| EUV | DUV | Metrology & Inspection System | |
| 2023 | 12,169.8 | 17,342.0 | 608.5 |
| 2024 | 14,987.1 | 18,621.8 | 640.1 |
| 2025 | 18,456.6 | 19,996.1 | 673.4 |
| 2026 | 22,729.3 | 21,471.8 | 708.4 |
| 2027 | 27,991.2 | 23,056.4 | 745.3 |
| 2028 | 34,471.1 | 24,758.0 | 784.0 |
| 2029 | 42,451.2 | 26,585.1 | 824.8 |
| % of Revenue | 40.00% | 57.00% | 2.00% |
The next step involves predicting net income margins, focusing on the duration of ups and downs in the semiconductor cycle. The lifespan of EUV lithography machines is set at 30,000 hours, translating to a range of 5-15 years. Semiconductor fabs can operate 24/7 to maximize production, leading to a wide range in durability. However, it’s reasonable to speculate that TSMC may be among the manufacturers operating 24/7. Additionally, given the expensive nature of the machines, manufacturers (including ASML) offer refurbishment services to extend their utility.
Q4 2023 ASML investors’ Presentation
In the table below, you can observe a sharp acceleration of digitalization in 2020, resulting in a quick surge in sales for ASML. The net income margin recorded by ASML was 25.42% in 2020, increasing to 31.61% in 2021. However, in 2022, the net income margin fell to 26.56%, and as of 2023, it stands at 28.44%.
| Net Income Margin % | Variance % | |
| 2017 | 23.06% | |
| 2018 | 23.68% | 0.62% |
| 2019 | 21.93% | -1.75% |
| 2020 | 25.42% | 3.49% |
| 2021 | 31.61% | 6.19% |
| 2022 | 26.56% | -5.05% |
| 2023 (TTM) | 28.44% | 1.88% |
| Avg | 25.82% |
Calculating the average growth displayed by ASML’s net income margin during periods of growth, we find an average of 3.04%, while during downturns, it has been an average 3.4% reduction. Typically, periods of growth last around 2 years, while downturns last approximately 1 year (based on the net income margin for the period 2017-2023). Thus, I will project that after 2025, ASML’s net income margin will decline, with another downturn anticipated in 2029.
| Net Income Margins | |
| 2024 | 27.02% |
| 2025 | 31.61% |
| 2026 | 28.21% |
| 2027 | 31.25% |
| 2028 | 34.29% |
| 2029 | 30.89% |
| Revenue | Net Income | Plus Taxes | Plus D&A | Plus Interest | |
| 2024 | $34,249.0 | $9,254.09 | $10,686.68 | $11,606.04 | $11,606.04 |
| 2025 | $39,126.1 | $12,367.77 | $14,282.37 | $15,201.73 | $15,201.73 |
| 2026 | $44,909.6 | $12,668.99 | $14,630.22 | $15,835.75 | $15,835.75 |
| 2027 | $51,792.9 | $16,185.27 | $18,690.84 | $20,081.14 | $20,081.14 |
| 2028 | $60,013.1 | $20,578.51 | $23,764.17 | $25,375.14 | $25,375.14 |
| 2029 | $69,861.1 | $21,580.10 | $24,920.82 | $26,796.14 | $26,796.14 |
| ^Final EBITA^ |
This model yields a more conservative result than the previous one, suggesting a fair price of $984.44, indicating a 13.4% upside from the current stock price. Furthermore, the future price is estimated to be $1744.93, translating into annual returns of 16.8%.
Risks to Thesis
The primary risk associated with ASML stems from the potentially more challenging cycles compared to those of semiconductor manufacturing companies. ASML’s business involves selling equipment to manufacture chips, which necessitates a significant period before equipment replacement, contrasting with chip manufacturing cycles.
The second risk concerns the possibility of deteriorating consumer conditions. Any decline in consumer demand for electronics, automobiles, appliances, etc., could lead to a reduction in chip demand. Since ASML sells equipment for chip manufacturing, this could dampen the demand for their products.
The third risk pertains to the need for continuous innovation to accelerate demand and reduce the duration of ups and downs in the semiconductor cycle. If there is suddenly a lack of innovations in the semiconductor market, there may be less need to replace lithography machines frequently.
Conclusion
In conclusion, ASML Holding N.V. emerges as an enticing investment opportunity, supported by robust financial performance and strategic positioning within the semiconductor equipment industry. Through meticulous valuation models, including DCF analyses based on both analysts’ estimates and projected revenue trends, ASML showcases strong growth potential. The DCF models reveal a fair price range, with the first model suggesting a fair price of $1124.65 and a future price projection of $1985.28 by 2029, translating into annual returns of 21.5%. Conversely, the second, more conservative model suggests a fair price of $984.44, with a future price projection of $1744.93 by the same period, translating into annual returns of 16.8%. While these models provide valuable insights, it’s crucial to acknowledge inherent risks such as cyclicality, consumer demand fluctuations, and technological disruptions.
Editor’s Note: This article discusses one or more securities that do not trade on a major U.S. exchange. Please be aware of the risks associated with these stocks.
