Mauricio Graiki/iStock via Getty Images
Introduction
The diversified manufacturer of various home, industrial, and auto-related components – Leggett & Platt, Incorporated (NYSE:LEG) has endured quite a challenging twelve months, losing 28% of its value at a time when the S&P 500 has generated positive returns of +23%.
YCharts
In a little over a week, LEG will face a notable event, which could serve as a key catalyst in determining the next course of action for the beleaguered LEG share. We are of course referring to the Q4-23 results which will be published on the morning of the 9th of Feb before market hours.
Earnings Event – What To Expect
In recent periods, Leggett & Platt has displayed quite a volatile track record with regard to meeting headline estimates, and that should understandably make investors cagey. For context over the last 9 quarters, the actual EPS delivered may have beaten expected EPS numbers by 4.5% on average, but that appears to be skewed heavily by the Q1 EPS beat of 50%. Otherwise over these past 9 quarters, we’ve seen LEG meet street estimates just once, and miss those estimates on 4 separate occasions, including the two most recent quarters.
Seeking Alpha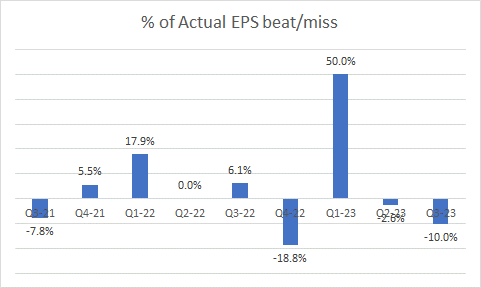
On the topline, LEG had witnessed a 9% contraction in its topline for the first nine months of the year, and it is reasonable to expect a similar cadence in Q4 as well as volumes in the furniture, flooring, and textile segment (31% of group sales), and the bedding product segment (42% of group sales) are expected to be weak yet again. On an FY basis, LEG’s topline is expected to come in within a range of $4.7 to $4.75bn with volumes in furniture, flooring, and textile, leading the weakness with an expected drop in double-digit terms.
A lot of attention will go towards Leggett & Platt’s cash flow performance in Q4 as historically, this has proven to be the strongest quarter for operating cash generation, mainly on account of heightened cash collections from its customers. However, do note, that all through the first three quarters of 2023, LEG was already witnessing sequential declines in its accounts receivables
YCharts
Whilst the operating cash flow (OCF) performance will be commendable enough in Q4, it won’t be a patch on what was seen a year ago where LEG ended up generating a whopping $247m of cash (driven mainly by strong collections as well as inventory drawdowns).
YCharts
LEG’s inventory days already dropped below its 3-year average in Q3, so we’re not convinced there’s ample juice left to facilitate further improvement on this front.
All in all, management had previously stated that they hope to generate $450-500m of operating cash for the FY. Given that they already delivered around $350m of cash for the first 9 months, you’re essentially staring at $100-$150m of OCF for Q4.
YCharts
Note that currently, the LEG stock’s FCF yield of 14.3% is almost twice as much as its 5-year average, but this will almost certainly dip once the Q4 results are out as it is highly unlikely that LEG comes up with over $250m of OCF in Q4 (the current FCF yield is based on the rolling twelve-month FCF).
Management commentary on the FCF outlook for the year will be worth watching, as this year, LEG will have the additional burden of meeting $300m of debt maturities due in November.
Investor Presentation
Speaking of debt, note that the net debt to EBITDA ratio had risen from 3.1x to 3.15x on a sequential basis (and is expected to come in around the 3.15 levels in Q4 as well), but this is not on account of a bloating debt component. The total debt, if anything, at $2.18bn, currently stands at 9-quarter lows. Rather, it’s the pressure on the operating front, where LEG’s Adjusted EBITDA base is contracting at a pace of 5% on a sequential basis, and 25% on an annual basis.
On the operating front, investors should look for commentary related to progress on the integration of LEG’s specialty foam and innerspring businesses, as this is expected to engender some manufacturing savings, and also make the distribution footprint more optimized.
Closing Thoughts – Is The Leg Stock A Good Buy?
Admittedly, the upcoming Q4 results are unlikely to have too many positives, but we still see quite a few merits at this juncture, that make us look at LEG more favorably as an investment proposition.
Firstly, there’s the long-standing dividend narrative which can be perceived to be the jewel in the crown. For the uninitiated LEG is a dividend king, and has been relentlessly lifting its dividends for 52 straight years now! Also note that in 33 out of the 34 last years, it has not only generated ample OCF to cover the dividends, but their CAPEX initiatives as well. It isn’t just the longevity of the dividend that’s worth highlighting.
At current prices, you can lock in a very tasty yield of 7.5% which is around 5-year highs, and also a good 300bps higher than what you’ve normally gotten over the last 5 years! The other key thing to note is that as part of LEG management’s TSR (Target Shareholder Return) targets, they aim to facilitate only a 3% yield, so that highlights what a great deal you’re getting here. Basically, opportunities to pick up these dividend kings at tasty yields don’t come along too often.
YCharts
Of course, some naysayers may point to LEG’s slowing YoY dividend growth trajectory over the last 6 years (see image below), but this is largely a function of the expanding base effect, and rather, investors need to acknowledge the consistency with which LEG has managed to bump up its dividends by $0.02 a year.
Stockcharts
In comparison to other high-yielding dividend achievers, it also looks like the Leggett & Platt stock looks like an ideal bet to play the mean-reversion theme. The image above shows how the relative strength ratio of LEG and a high-yield dividend achievers’ portfolio is now at levels last seen in 2008, and this could drive some interest toward the stock.
Then, do note that after the underwhelming management guidance provided at the Q3 event in late October, the sell-side community has trimmed its FY25 EPS estimates by almost -14%.
YCharts
In light of double-digit cuts on the EPS forecast, which would have damaged the base, one would have expected the forward P/E to look quite high, but such has been the correction in the share price, that forward valuations look very alluring now. As things stand, LEG can now be picked up at a 25% discount to the stock’s 5-year average of 20.4x
YCharts
Finally, if we switch over to LEG’s long-term charts, we’re encouraged by the current reward-to-risk on offer. The 14-year chart shows us that the LEG stock typically bottoms out at the $18-$26 levels, and tops put at the sub $60 levels. As things stand, the LEG stock is now at a point seen during the pandemic lows. Note that this terrain also served as a congestion zone for the stock for 3 years from 2009-2012, and we wouldn’t be surprised to see some bargain-hunting support come in at these levels.
Investing

 Q2 2024 Earnings Call Transcript")

