
gremlin
Tech stocks continue to lift the market. There’s no revelation with that statement. But the advance over the past three months is remarkable in that the growth-focused sector has now outpaced all other S&P 500 sectors from the lows notched last October. Tech’s weighting in the SPX has soared to new heights (since 2000), too.
Still, we have seen a resurgence among more cyclical spaces such as Financials and Real Estate. The Energy sector actually managed to post the biggest climb last week, rallying better than 5% on oil’s price breakout. Ahead of mega-cap tech earnings due out this week, including Q4 reports from the likes of Microsoft (MSFT), Alphabet (GOOG), Amazon (AMZN), Meta Platforms (META), and Apple (AAPL), expect fireworks over the coming days in the Technology Select Sector SPDR Fund ETF (NYSEARCA:XLK). While not all of those companies are technically in the I.T. sector, they often trade in unison.
I have a hold rating on the fund. I see its valuation has been historically lofty, and mega-cap earnings week has been somewhat weak in recent quarters – and that comes before a tough stretch on the calendar through mid-March. Moreover, the I.T. sector trades at a high 27x forward earnings multiple, though the technical chart is extraordinarily strong.
Earnings on Tap
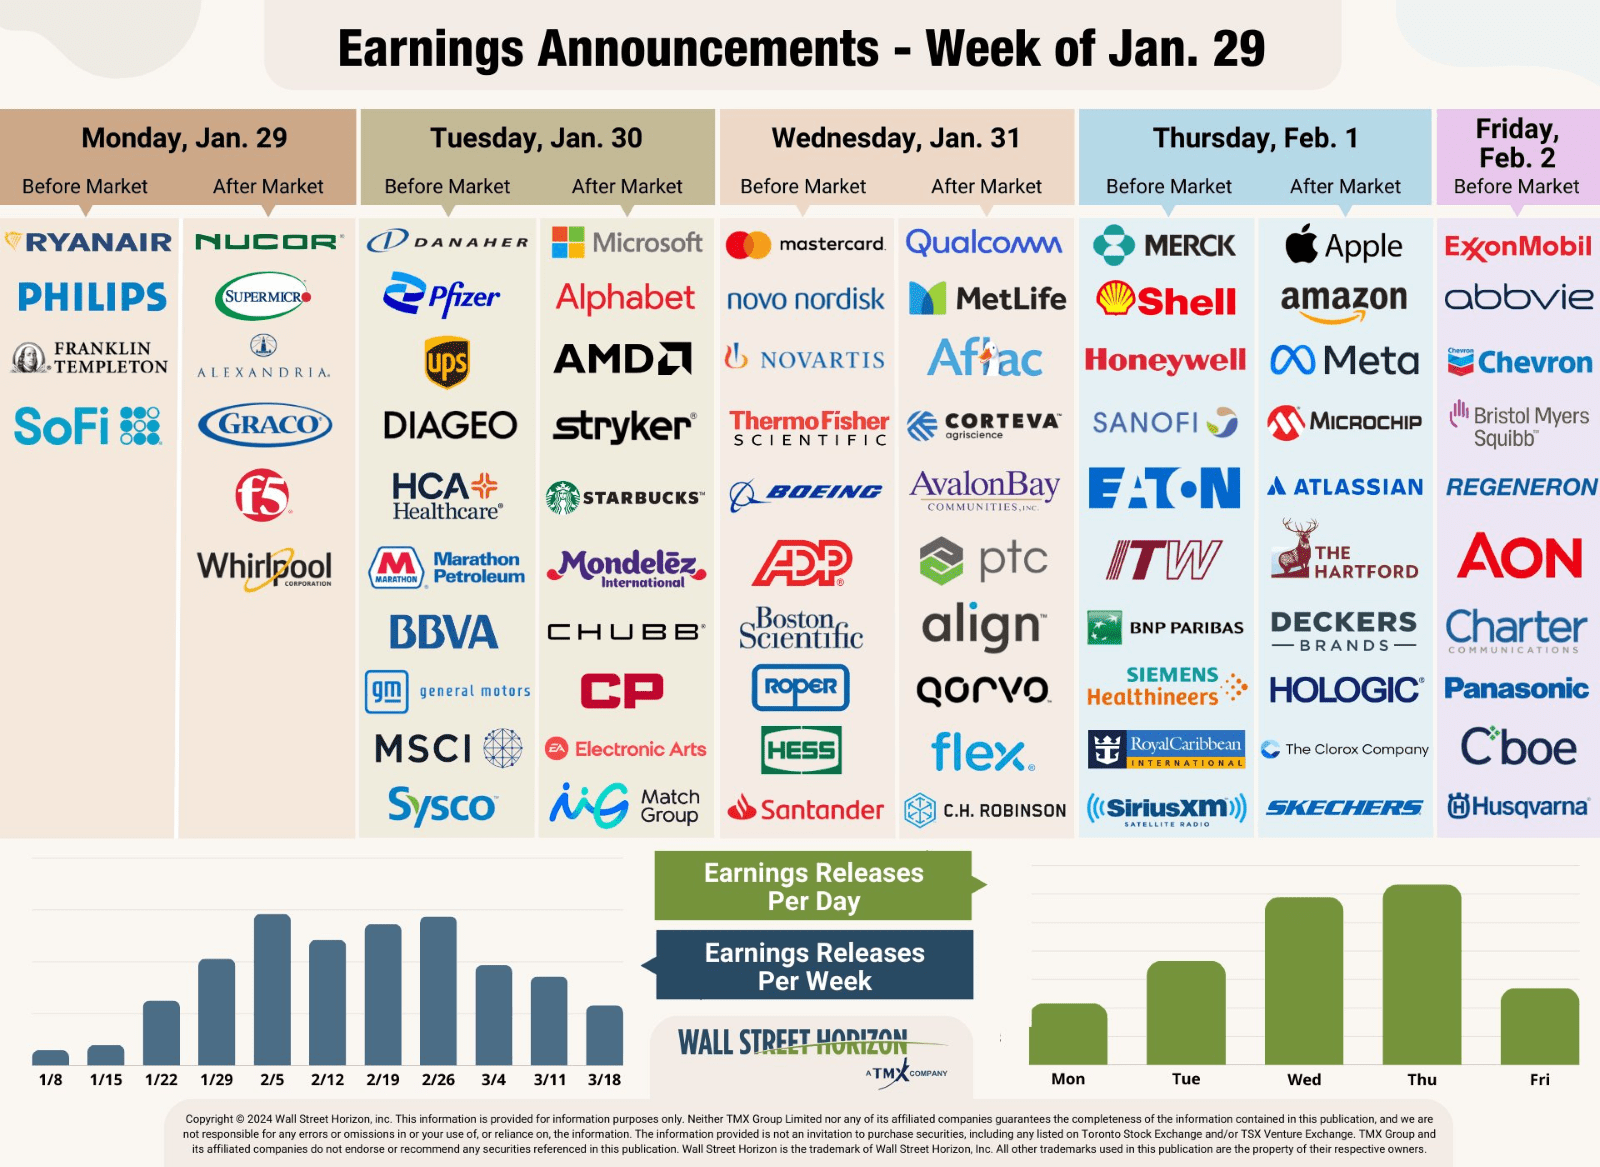
Wall Street Horizon
Sector Returns Last 3 Months: Tech Leads
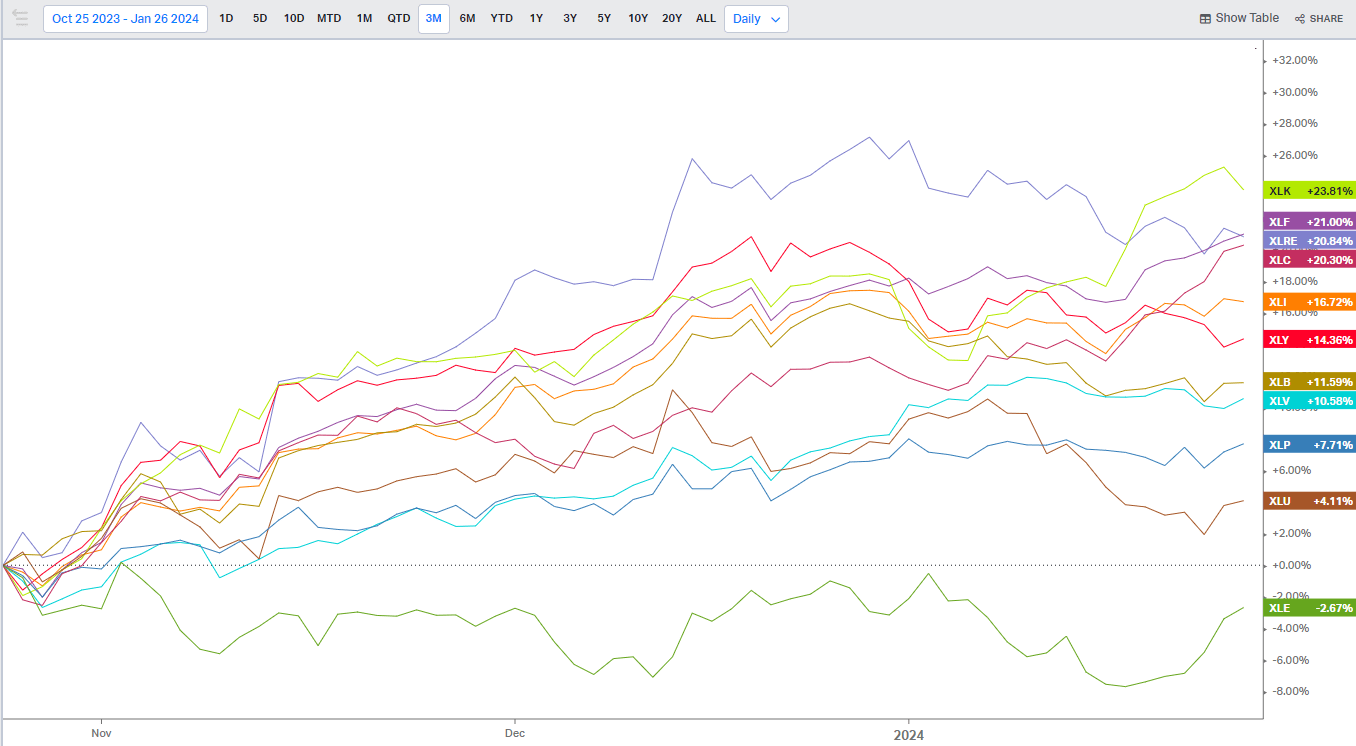
Koyfin Charts
S&P 500 Sector Valuations: I.T. 27.1x Earnings, Above Its 5- and 10-Year Averages
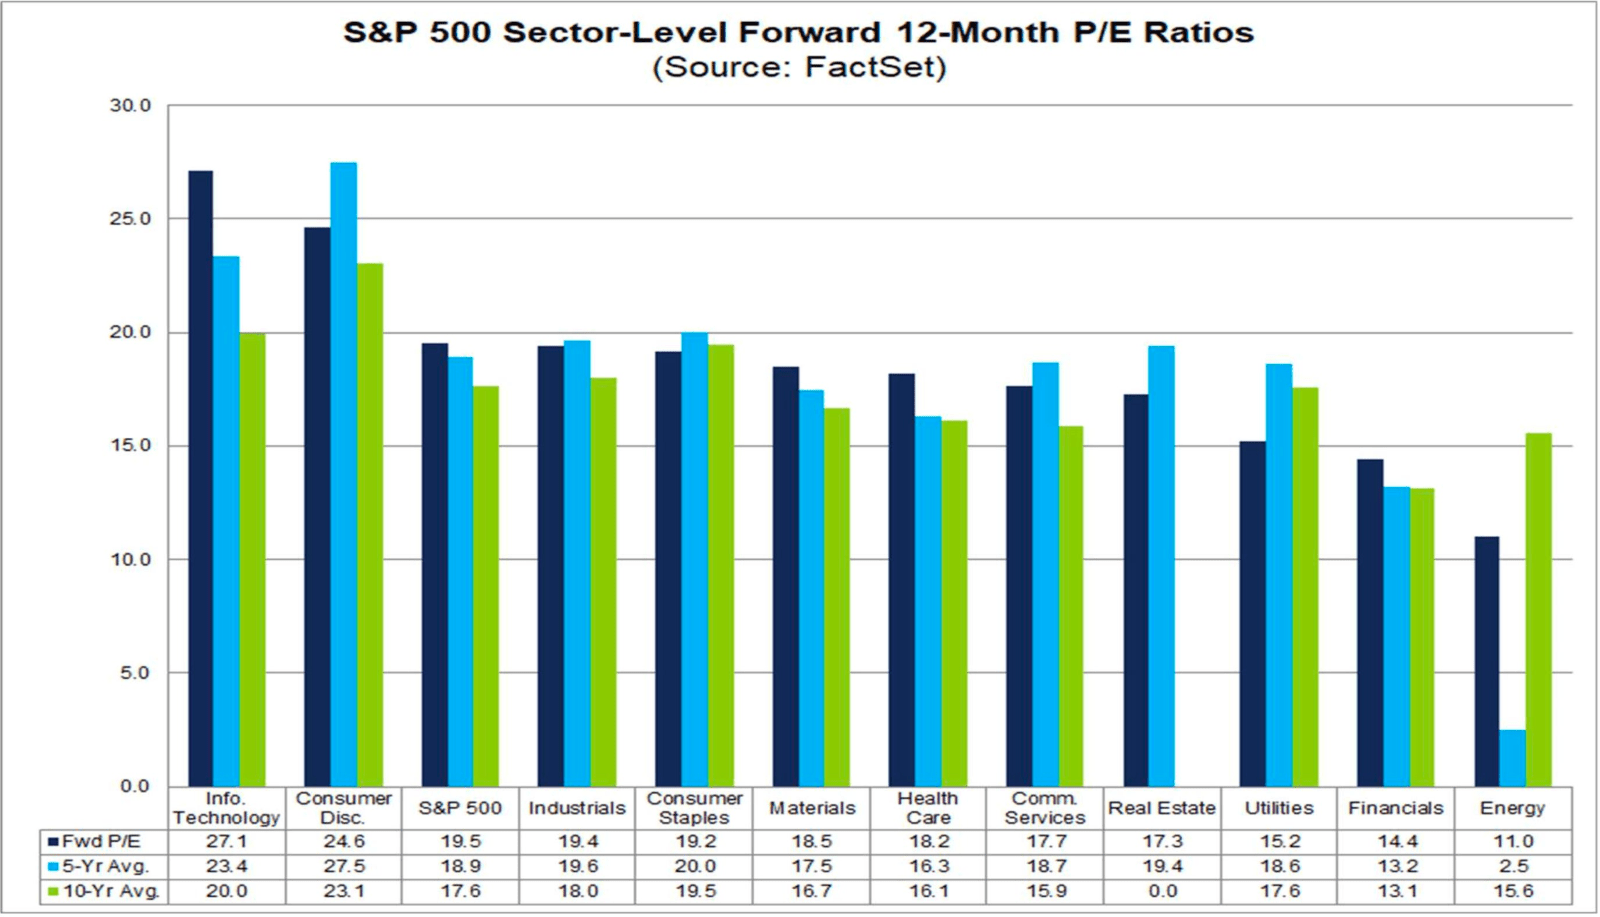
FactSet
Info Tech Most Expensive Sector
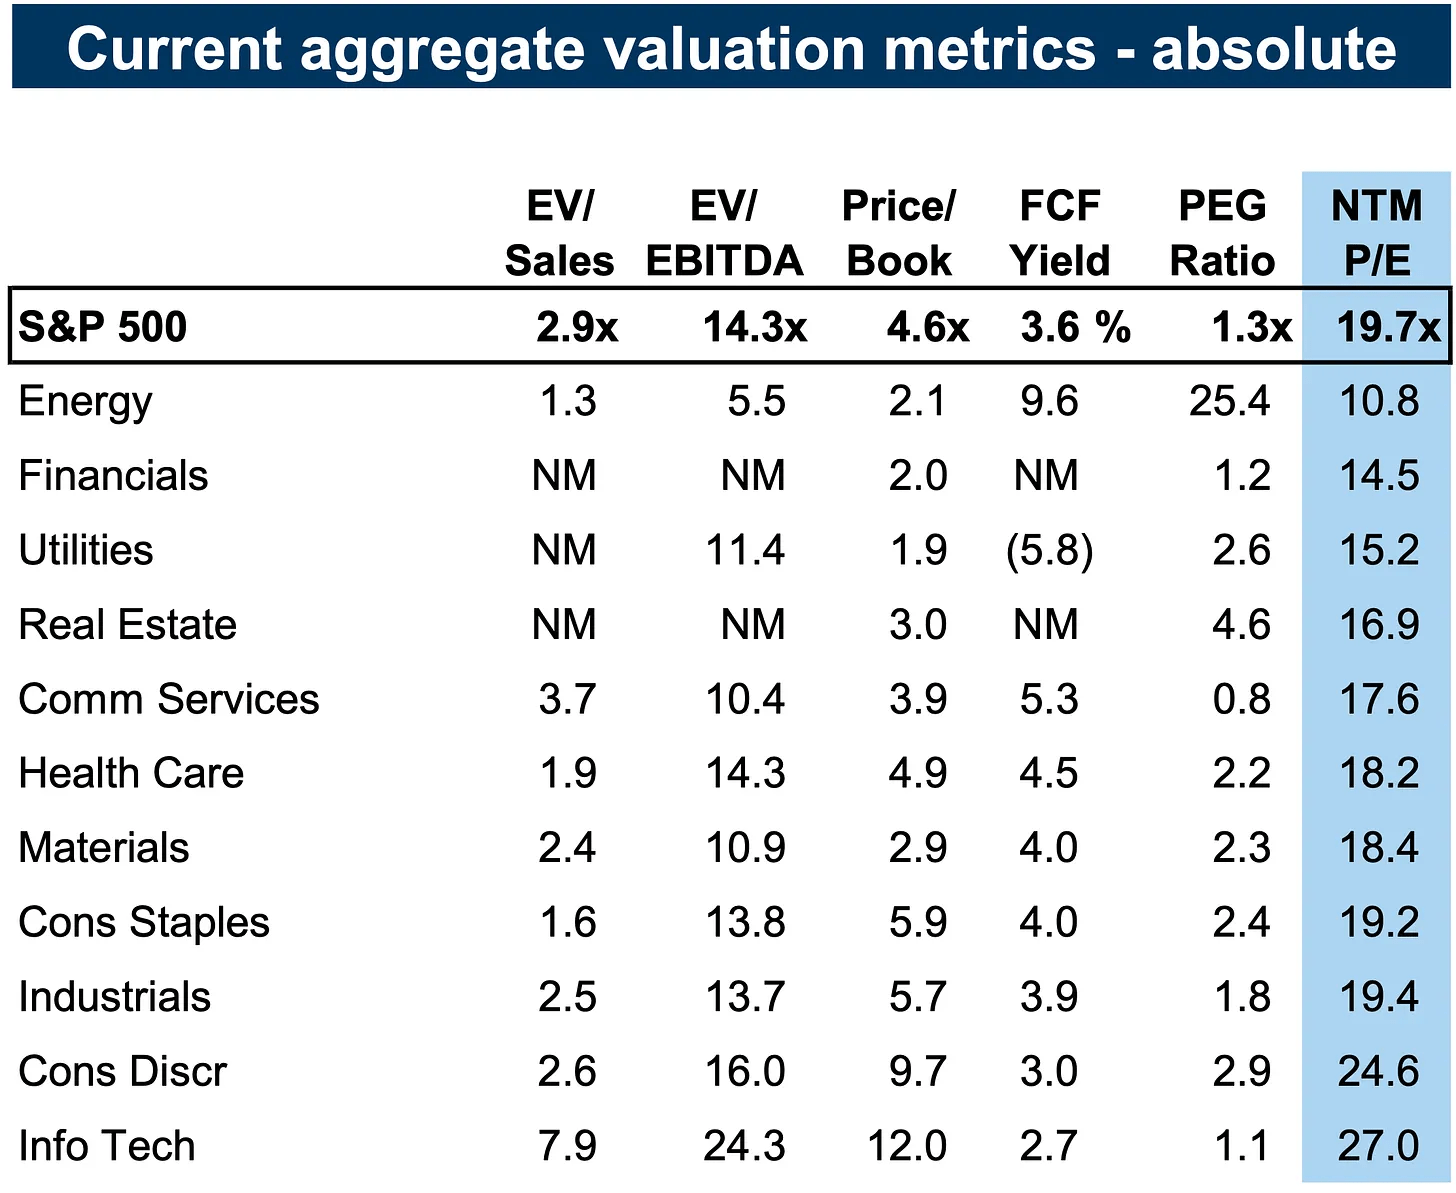
Goldman Sachs
Tech Earnings Growth Seen the Strongest Among the 11 Sectors
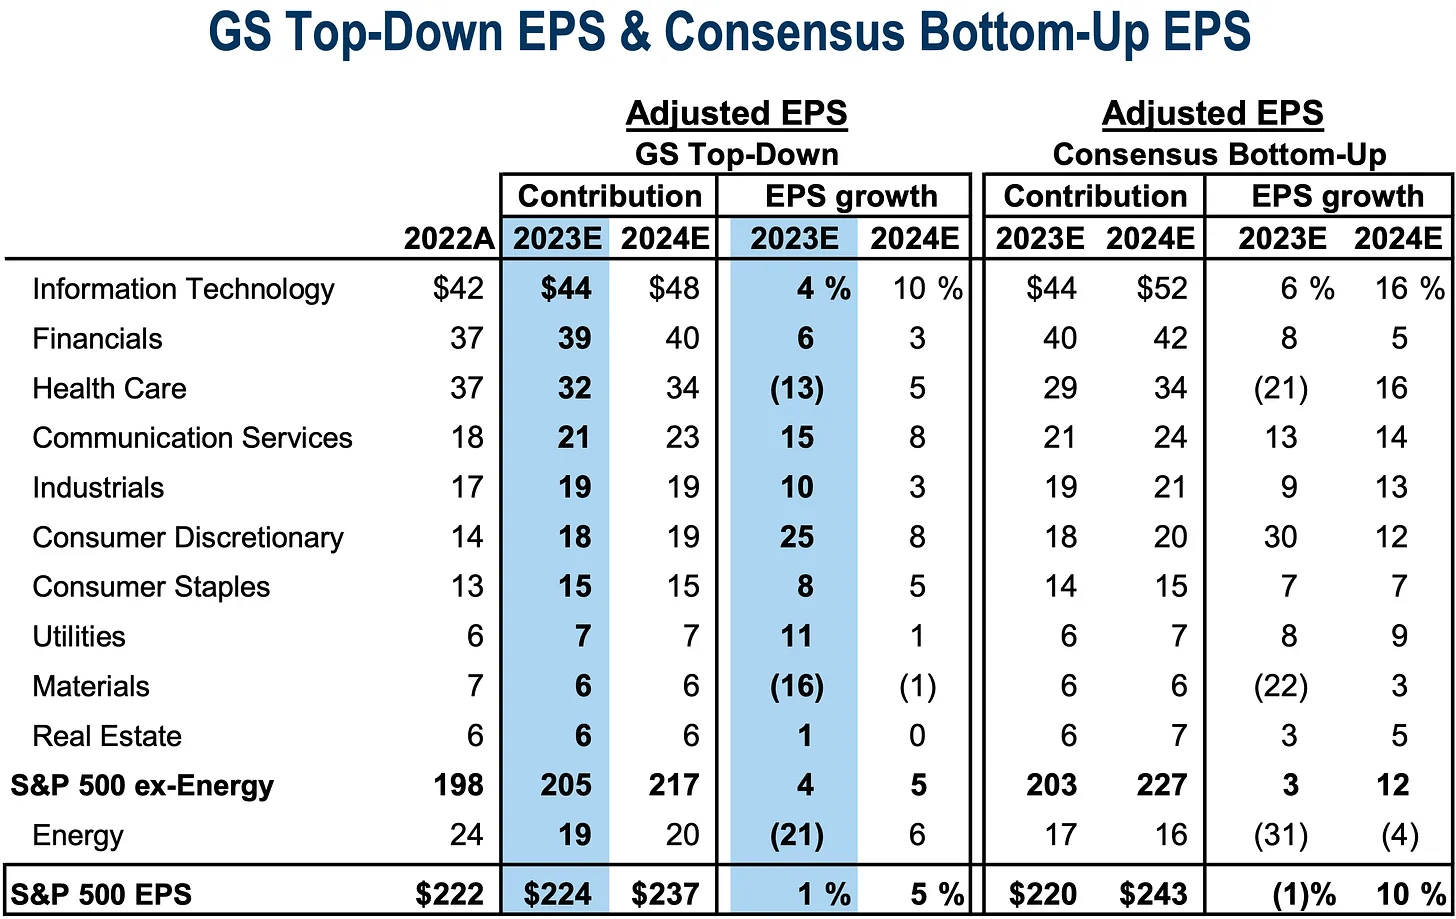
Goldman Sachs
According to the issuer, XLK seeks to provide investment results that, before expenses, correspond generally to the price and yield performance of the Technology Select Sector Index. The fund offers investors exposure to companies from technology hardware, storage, and peripherals; software; communications equipment; semiconductors and semiconductor equipment; IT services; and electronic equipment, instruments, and components.
Number 3 out of 88 in its ETF Sub Class by Seeking Alpha’s ETF Quant Rankings, XLK is a large fund with more than $62 billion in assets under management and it pays a small 0.7% trailing 12-month dividend yield. Share-price momentum on the ETF has been quite robust over many timeframes, helping to lead the S&P 500 to fresh all-time highs in recent sessions.
XLK features a low 0.10% annual expense ratio and risk is somewhat low given its modest standard deviation metrics, though the fund is concentrated in a handful of correlated companies. Still, liquidity with the ETF is very strong given its 90-day average volume of almost 7 million shares while XLK’s 30-day median bid/ask spread is narrow at a single basis point.
Digging into the portfolio, the 5-star, silver-rated fund by Morningstar plots in the upper right corner of the style box, indicating that there’s a heavy amount of large-cap growth exposure. Just 7% of the allocation is considered mid-cap and there is no small-cap exposure. Trading 27 times earnings and with a long-term EPS growth rate of 11%, the PEG ratio is lofty at 2.5, though profit growth in the short run will easily exceed the long-term average.
XLK: Portfolio & Factor Profiles
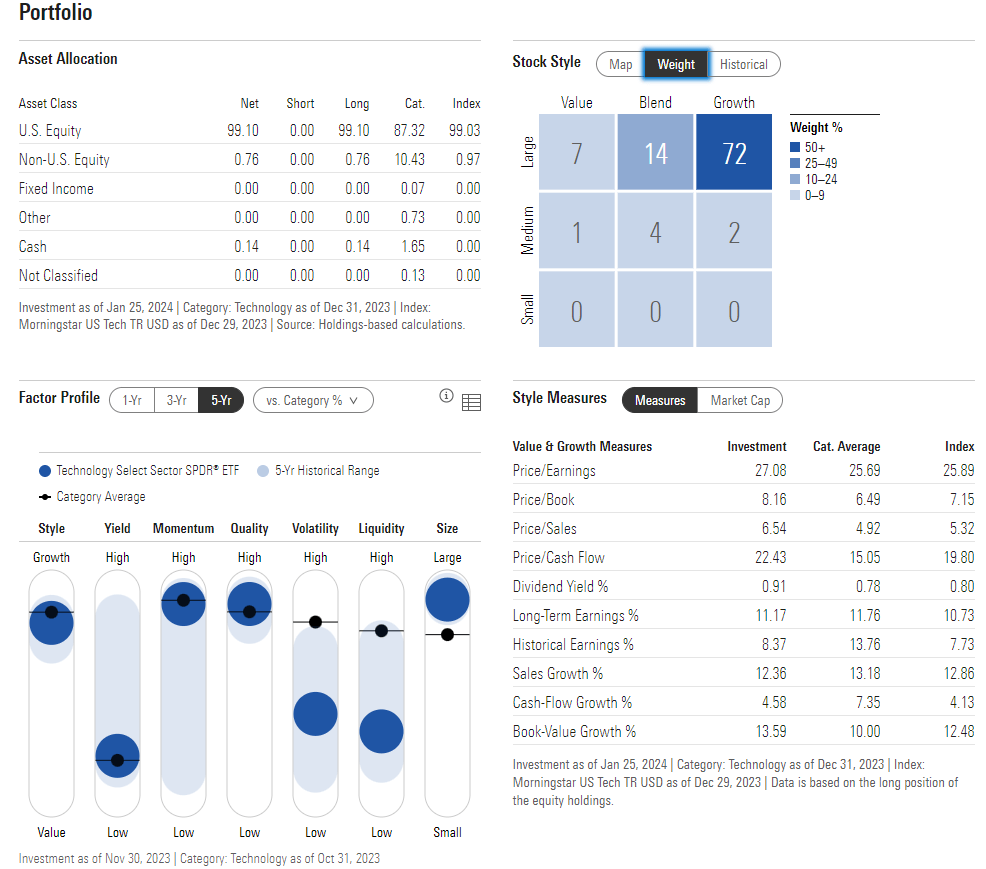
Morningstar
XLK’s potential peril is seen in its allocation of individual stocks. More than 40% of the fund is invested in just two companies: Microsoft and Apple. Paying close attention to fundamental happenings with the world’s two largest publicly traded firms is important. Both companies sell at high P/Es. Apple’s revenue growth has been soft over recent quarters while critics suggest that Microsoft’s world-class business model comes at an expensive price tag.
XLK: Holdings & Dividend Information
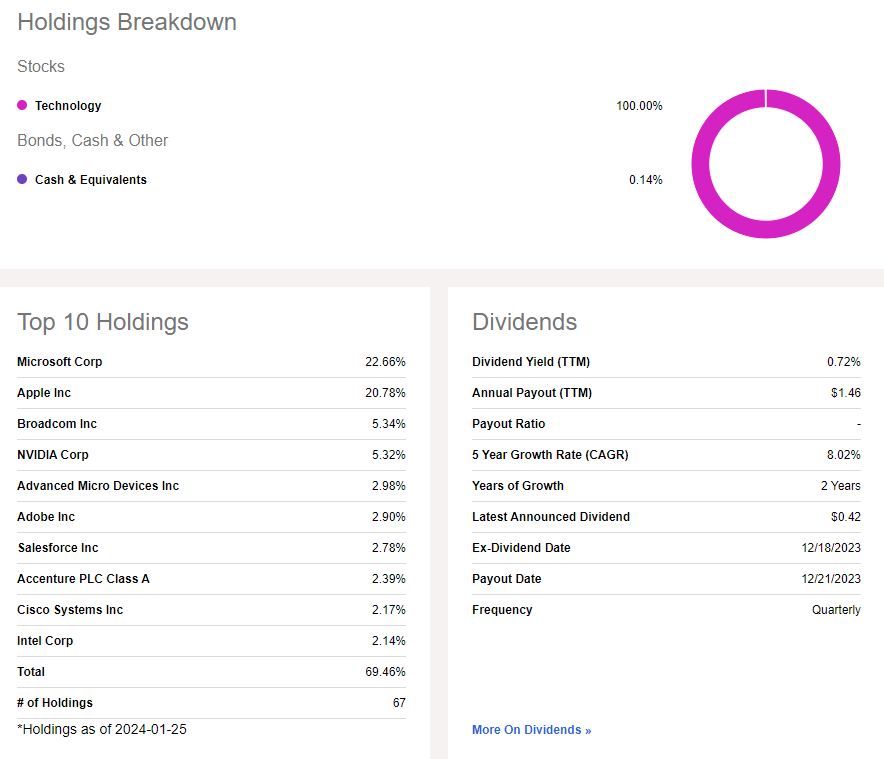
Seeking Alpha
XLK has been among the best sector funds in the last two decades, and its seasonal strength is seen throughout the year, according to data from Equity Clock. Investors may want to be on guard for volatility during the latter half of February – that is one of the worst historical two-week periods for equities.
XLK: Big Long-Run Returns, Some Q1 Speedbumps
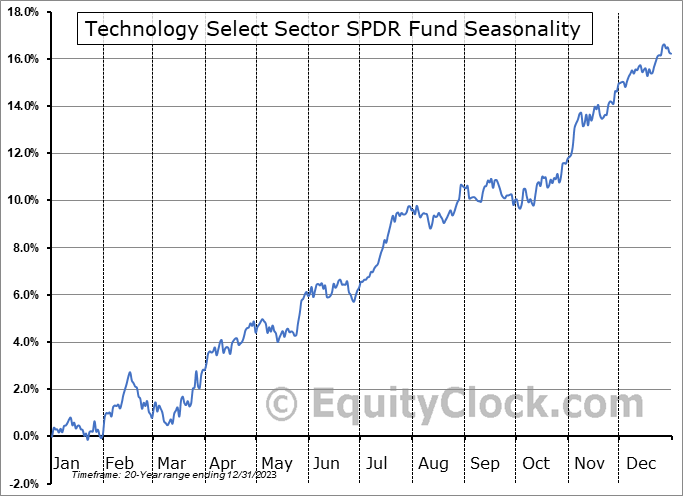
Equity Clock
The Technical Take
With mega-cap tech earnings on tap and a high valuation, XLK’s technical chart is impressive. Notice in the graph below that momentum is robust following a cup-with-handle breakout pattern that took place late last year. Shares had peaked in late 2021 and early 2022 at the $177 mark. A steep 36% bear market then ensued. The ETF found a bottom in October 2022 after meeting resistance at its long-term 200-day moving average the previous August. The bulls managed to send XLK above the 200dma by early last year, and a higher low at $134, holding the rising 200dma, helped to cement the bearish to bullish rounded bottom reversal pattern.
Also, take a look at what transpired in Q3 and Q4 2023. XLK notched a new high, above $180, but then dropped back in what could have become a bearish false breakout pattern. Alas, it was a garden-variety correction with waves up rebounds and then lower lows. The dip was just 11%, and the 200dma was not even tagged. The buying spree from late October through just last week surprised value investors, and key support is now in the $177 to $183 range. There have been a few red days since the middle of December. What’s more, the RSI momentum oscillator at the top of the graph helps to confirm the strong price rise. Finally, with a high amount of volume by price from $175 and lower, there should be ample support for significant pullbacks.
Overall, XLK’s chart is impressive and powerful. If you can buy it on the dip toward the low $180s, that appears as a favorable setup as some bearish seasonality is about to ensue.
XLK: Bullish Rounded Bottom, Cup with Handle Patterns
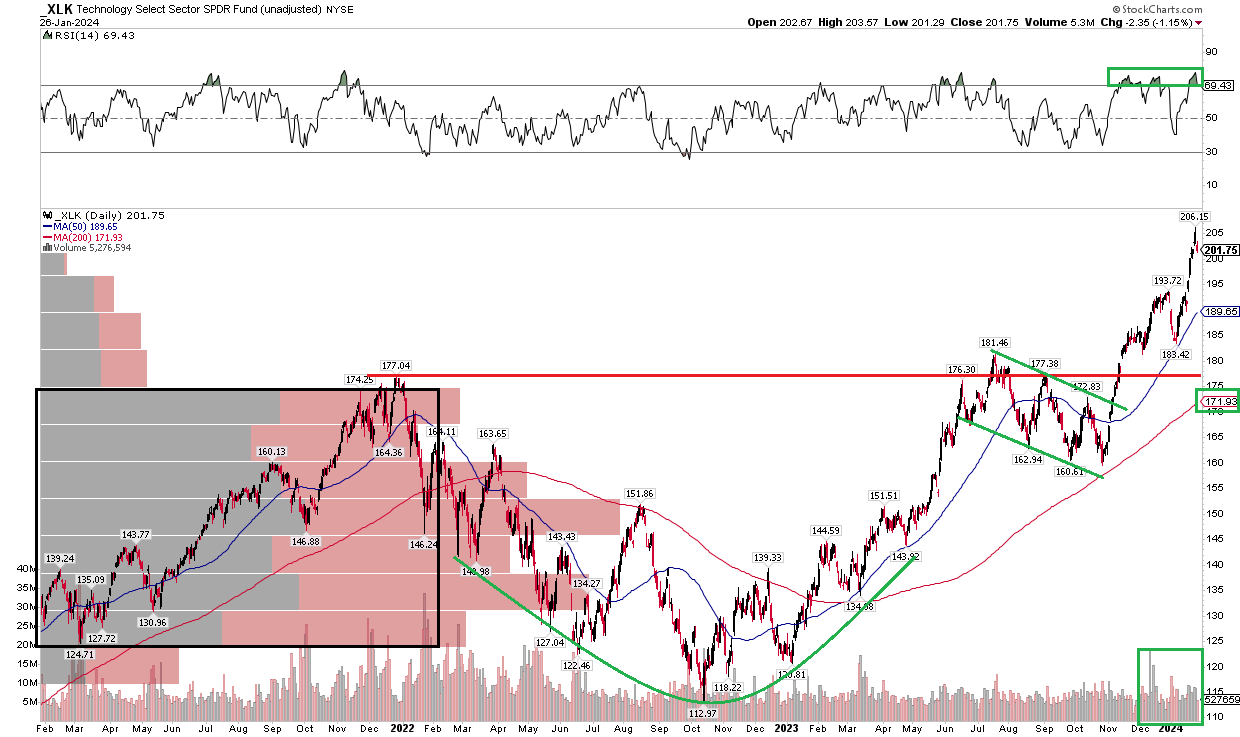
StockCharts.com
The Bottom Line
I have a hold rating on XLK. Its normalized PEG ratio is lofty ahead of tech earnings week. While the ETF’s momentum is strong, buying on a pullback to the $180s may be a more prudent approach today.

 Q2 2024 Earnings Call Transcript")

