monsitj
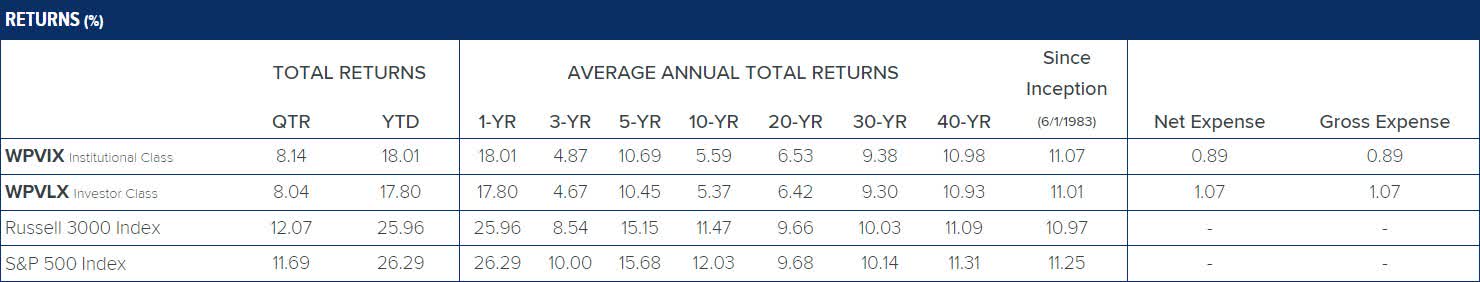
The Multi Cap Equity Fund’s Institutional Class returned +8.14% for the fourth quarter compared to +12.07% for the Russell 3000. For the calendar year, the Fund’s Institutional Class returned +18.01% compared to +25.96% for the Russell 3000.
Strong fourth-quarter performance placed an exclamation point on an already good year for holders of risk assets. Dovish comments from Federal Reserve Chair Jerome Powell in late October reinforced expectations of easier financial conditions in 2024, sparking many press outlets to coin 2023’s market action as an “everything rally.” To be sure, the year ended strong for nearly all risk assets, including our portfolio. However, we note that even in a so-called everything rally, everything does not rally uniformly.
To illustrate the point, consider 2023’s “Magnificent Seven” stocks (Alphabet, Inc. (GOOG), Apple, Inc. (AAPL), Amazon.com, Inc. (AMZN), Meta Platforms, Inc. (META), Microsoft Corp. (MSFT), NVIDIA Corp. (NVDA), and Tesla, Inc. (TSLA)). As a reminder, most major indices are market capitalization weighted. As a result, out of 3,000 companies, the Magnificent Seven comprised roughly 22% of the total Russell 3000 Index. It was indeed a magnificent year for these companies, delivering an estimated 60% weighted average return in 2023 and contributing half of the index’s overall return.
Smaller and mid-cap companies, while also strong, did not keep pace with their larger brethren, as illustrated by the small-cap Russell 2000 and Russell Midcap indices rising roughly 17% each. We believe the underlying disparity in returns such as these creates potential future opportunities, particularly after a multi-year period of larger company outperformance. Our Multi Cap Equity Fund is built upon the idea that our Quality at a Discount framework is applicable to businesses of all sizes, weighted according to our assessment of each one’s opportunity set.
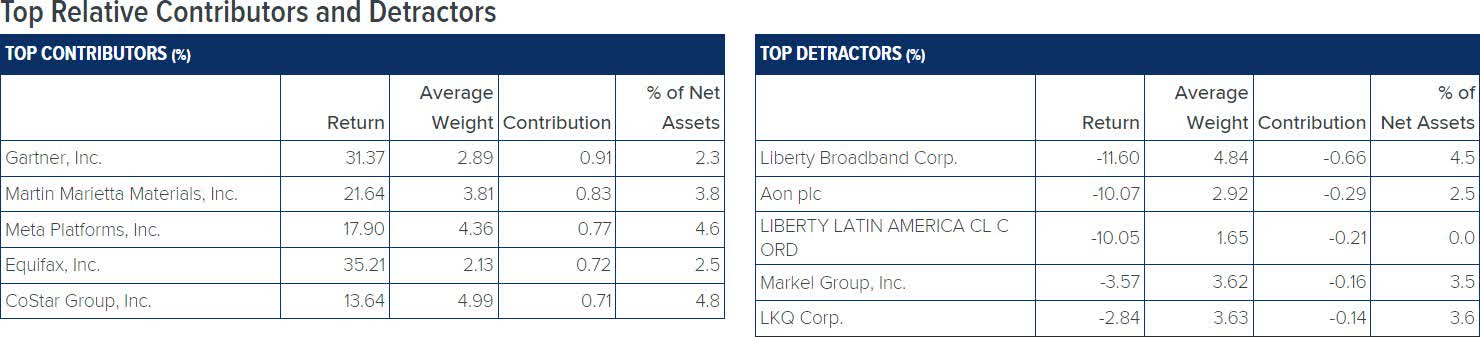
Our top contributors for the year demonstrate our commitment to pursuing a multi-cap strategy, featuring businesses ranging in size from $1.7 trillion to less than $10 billion. Meta’s “year of efficiency” (an initiative to cut costs and create a leaner organization), coupled with renewed operating momentum, resulted in a near tripling of the stock price in 2023. Google parent Alphabet enjoyed outsized gains early in the year as it rolled out its generative AI platform and tools. Guidewire Software, Inc. (GWRE) shares rose thanks to insurance companies’ increased adoption of its cloud platform along with signs of competitive gains. The strong fourth-quarter rally drove broad gains across the portfolio, with research services provider Gartner, Inc. (IT) leading the pack, followed by Meta and building materials provider Martin Marietta Materials, Inc. (MLM) (also a top contributor for 2023). All three of these companies produced double-digit gains for the year.
Liberty Broadband Corp. (LBRDA), a holding company owning 31% of Charter Communications, was our top detractor for the quarter. Shares slumped as Charter’s CFO commented at a recent conference that competition for new broadband subscribers remains elevated. Although most investors are singularly focused on current subscriber trends, we believe longer-term growth opportunities from the company’s new-build activity and wireless businesses remain intact. Aon plc (AON), another top quarterly detractor, announced a $13.4 cash and stock deal to acquire NFP Corp., a mid-market-focused provider of insurance and benefits brokerage services. Although investors were dissatisfied with the deal’s price tag, the proposed combination improves Aon’s ability to compete in the faster-growing mid-market customer segment, and we are optimistic about the combined entity’s improved prospects.
Our top detractors for 2023 were First Republic Bank (OTCPK:FRCB) and Charles Schwab Corporation (SCHW). We sold both during the first quarter in the wake of regional bank stress. Perimeter Solutions SA (PR) was also a top detractor for the year. Perimeter is the leading provider of fire retardants and firefighting foam used to combat wildfires. Acres burned in Perimeter’s markets, particularly California, were significantly below average for the second year in a row, diminishing cash flow and obscuring the company’s earnings power compared to a more typical year.
In response to the strong fourth-quarter rally, portfolio activity tilted toward sales, with material trims of Guidewire Software, Gartner, Martin Marietta Materials, and Vulcan Materials Co. (VMC) on strength. We also exited the stub position in MachTen, Inc. (OTC:MACT) that was spun from LICT Corp. (LICT US) last quarter. On the buy side, we made additions to our holdings of ACI Worldwide, Inc. (ACIW US) and Danaher Corp. (DHR). Additionally, Danaher completed the spin-off of its water and product quality business, Veralto Corp. (VLTO), our sole new holding this quarter. We view Veralto as an advantaged, high-quality business, particularly as its water segment exhibits both long-term secular growth tailwinds and defensive characteristics. As a stand-alone entity, steeped in the Danaher culture and operating model, we anticipate Veralto is well positioned to execute on its existing businesses as well as opportunistic acquisitions.
To reiterate, we believe that investing in businesses of all sizes, using our Quality at a Discount framework, is an enduring advantage of a multi-cap investing strategy. Valuation remains our North Star, and we think our stocks are priced at reasonable, attractive discounts to business value. Collectively, the portfolio trades at an estimated price-to-value ratio in the mid 80’s, a level that suggests we can earn healthy, risk-adjusted returns.
| Data is for the quarter ending 12/31/2023. Holdings are subject to change and may not be representative of the Fund’s current or future investments. Contributions to performance are based on actual daily holdings. Returns shown are the actual returns for the specified period of the security. Additional securities referenced herein as a percent of the Fund’s net assets as of 12/31/2023: ACI Worldwide, Inc., 2.1%; Alphabet, Inc., 6.5%; Amazon.com, Inc., 0.0%; Apple, Inc., 0.0%; Danaher Corp., 3.2%; First Republic Bank, 0.0%; Guidewire Software, Inc., 2.4%; LICT Corp., 1.3%; MachTen, Inc., 0.0%; Martin Marietta Materials, Inc., 3.8%; Microsoft Corp., 0.0%; NFP Corp., 0.0%; NVIDIA Corp., 0.0%; Perimeter Solutions SA, 1.7%; Tesla, Inc., 0.0%; The Charles Schwab Corporation, 0.0%; Veralto Corp., 1.1%; and Vulcan Materials Co., 3.6%. |
|
The opinions expressed are those of Weitz Investment Management and are not meant as investment advice or to predict or project the future performance of any investment product. The opinions are current through 01/20/2024, are subject to change at any time based on market and other current conditions, and no forecasts can be guaranteed. This commentary is being provided as a general source of information and is not intended as a recommendation to purchase, sell, or hold any specific security or to engage in any investment strategy. Investment decisions should always be made based on an investor’s specific objectives, financial needs, risk tolerance and time horizon. Data quoted is past performance and current performance may be lower or higher. Past performance is no guarantee of future results. Investment return and principal value of an investment will fluctuate, and shares, when redeemed, may be worth more or less than their original cost. Please visit weitzinvestments.com for the most recent month-end performance. Investment results reflect applicable fees and expenses and assume all distributions are reinvested but do not reflect the deduction of taxes an investor would pay on distributions or share redemptions. Net and Gross Expense Ratios are as of the Fund’s most recent prospectus. Certain Funds have entered into fee waiver and/or expense reimbursement arrangements with the Investment Advisor. In these cases, the Advisor has contractually agreed to waive a portion of the Advisor’s fee and reimburse certain expenses (excluding taxes, interest, brokerage costs, acquired fund fees and expenses and extraordinary expenses) to limit the total annual fund operating expenses of the Class’s average daily net assets through 07/31/2024. The Gross Expense Ratio reflects the total annual operating expenses of the fund before any fee waivers or reimbursements. The Net Expense Ratio reflects the total annual operating expenses of the Fund after taking into account any such fee waiver and/or expense reimbursement. The net expense ratio represents what investors are ultimately charged to be invested in a mutual fund. On 12/31/1993, Partners Value Fund succeeded to substantially all of the assets of Weitz Partners II Limited Partnership. The investment objectives, policies and restrictions of the Fund is materially equivalent to those of the Partnership, and the Partnership was managed at all times with full investment authority by the Investment Adviser. The performance information includes performance for the Partnership. The Partnership was not registered under the Investment Company Act of 1940 and, therefore, were not subject to certain investment or other restrictions or requirements imposed by the 1940 Act or the Internal Revenue Code. If the Partnership had been registered under the 1940 Act, the Partnership’s performance might have been adversely affected. Performance quoted for Institutional Class shares before their inception is derived from the historical performance of the Investor Class shares and has not been adjusted for the expenses of the Institutional Class shares, had they, returns would have been different. Index performance is hypothetical and is shown for illustrative purposes only. You cannot invest directly in an index. The Russell 3000 measures the performance of the largest 3,000 U.S. companies representing approximately 98% of the investable U.S. equity market. The S&P 500 is an unmanaged index consisting of 500 companies generally representative of the market for the stocks of large-size U.S. companies. Consider these risks before investing: All investments involve risks, including possible loss of principal. These risks include market risks, such as political, regulatory, economic, social and health risks (including the risks presented by the spread of infectious diseases). In addition, because the Fund may have a more concentrated portfolio than certain other mutual funds, the performance of each holding in the Fund has a greater impact upon the overall portfolio, which increases risk. See the Fund’s prospectus for a further discussion of risks related to the Fund. Investors should consider carefully the investment objectives, risks, and charges and expenses of a fund before investing. This and other important information is contained in the prospectus and summary prospectus, which may be obtained at weitzinvestments.com or from a financial advisor. Please read the prospectus carefully before investing. Weitz Securities, Inc. is the distributor of the Weitz Funds. |
Editor’s Note: The summary bullets for this article were chosen by Seeking Alpha editors.
Editor’s Note: This article discusses one or more securities that do not trade on a major U.S. exchange. Please be aware of the risks associated with these stocks.

 Q2 2024 Earnings Call Transcript")

