baona
Written by Nick Ackerman, co-produced by Stanford Chemist.
Energy keeps the world moving. Adams Natural Resources Fund (NYSE:PEO) provides exposure to primarily the world’s largest energy companies – though they also offer a bit of diversification. This closed-end fund trades at a big discount for big oil exposure. The fund also provides a regular distribution along with a year-end ‘topper’ payout to meet the 6% minimum distribution rate.
I believe the above reasons make it worth considering this fund for your energy exposure. It appears Saba Capital Management believes it’s a good place to put capital to work as well. This activist group has built a position in this fund, now amounting to over 7% of the outstanding shares. PEO isn’t necessarily the largest fund, but that’s still a substantial weight to be carrying.
PEO Basics
- 1-Year Z-score: -0.54
- Discount: -16.71%
- Distribution Yield: 1.95% (regular distribution only)
- Expense Ratio: 0.64%
- Leverage: N/A
- Managed Assets: $633.4 million
- Structure: Perpetual
PEO “seeks to deliver superior returns over time by capitalizing on the long-term demand for energy and materials. The Fund invests in energy and natural resources stocks and seeks to generate returns that exceed its benchmark as well as consistently distribute dividend income and capital gains to shareholders.”
Similar to the other Adams fund, Adams Diversified Equity Fund (ADX), PEO has an incredibly long history. The inception date goes back to 1929. PEO also went through a name change when ADX had. Formerly, the fund was known as the Petroleum & Resources Corporation. Being a non-leveraged fund is likely one of the reasons it has been around for so long, as it has a minimal chance of actually ‘blowing up.’ Now, it is true that no closed-end fund has ever gone bust historically but going down 70 to 80% and then liquidating is always possible.
Deep Discount And Potentially Brighter Future
Since our last update, which goes back to late 2022, the fund’s performance has been flat. Being that it is over a year, seeing flat results could certainly be disappointing to some investors. However, when adding in some context of what the energy space was doing overall during this time, we can also see flat results. Below is a measuring PEO up against Energy Select Sector SPDR ETF (XLE) for some context.
YCharts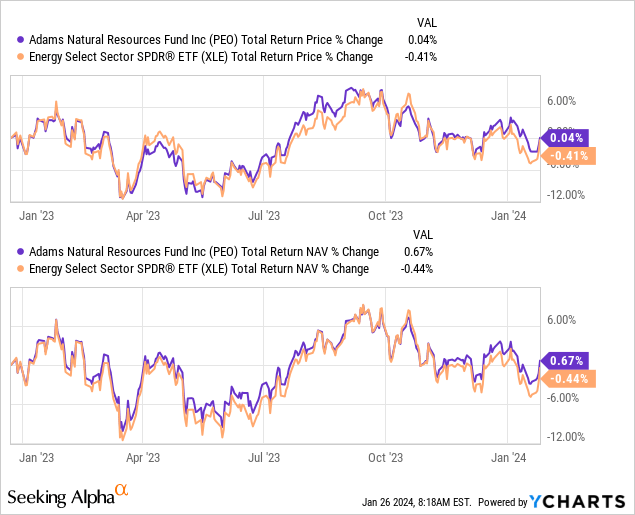
This is mostly a reflection of the energy space having a muted 2023, but that was after a really strong 2021 and 2022. The energy sector is an incredibly cyclical area of the market, and that makes it volatile.
Looking back at the last 10 years, energy is either the best-performing sector or the worst, with only two years where it was the second worst. 2023 showed the sector as the second worst, and that was along with 2017.
That’s somewhat kind of coincidental in the last decade. Going back further, there are some years where energy was the middle of the pack. Still, I think it is pretty noteworthy as investors either seem to go all-in or all-out of the sector. It also helps highlight the volatility of the space, which more tactical investors may be able to use to their advantage.
The hard part is predicting when energy will be a weaker or stronger performer. That comes down to the economy, and the reasons why energy was weaker in the last year were driven by two factors. That was sufficient supply with an anticipated weaker economic outlook. The U.S. and Canada produced a record amount of oil and natural gas in 2023. The Fed was actively working against the sector by raising rates to put a damper on economic activity in an effort to slow inflation.
With rate cuts or at least a stabilization in rates, we can get a better outlook going forward. Given that energy was a weaker performer, the outlook for rates to go lower while being able to have a growing economy still should bode well for the space. With PEO, you are also getting a deep discount on this fund.
Admittedly, this fund always trades at a deep discount, along with its sister fund from the same fund sponsor. On the other hand, it is trading a bit below its longer-term average, and that can provide a decent entry price, though not a great one. If Saba eventually shakes some things up for this fund, we could see another potential discount-narrowing catalyst, too.
YCharts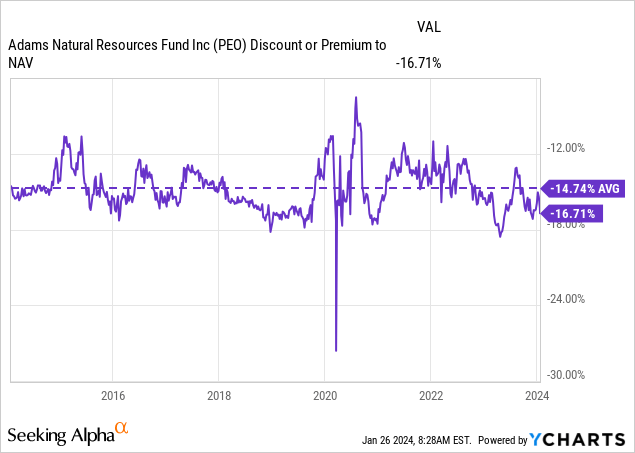
Delivering 6%+ Distribution Yields
This fund has a managed distribution policy in that they’ll pay a relatively low regular quarterly distribution but then top it off at the end of the year.
PEO Distribution History (CEFConnect)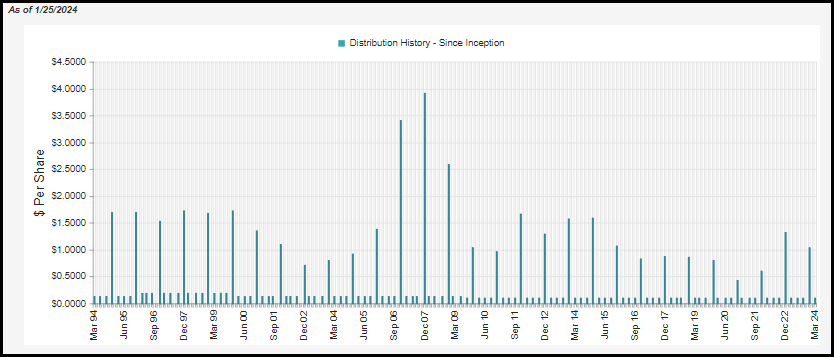
The policy is based on a minimum 6% payout rate, but that means it can be well in excess of that rate. For 2023, it appears they had just cleared the 6% hurdle at an annual distribution rate of 6.2%. However, in 2022, it worked out to an 8.1% rate. So, it can vary quite substantially between years, but this fund has otherwise kept it pretty consistently near 6 to 7% in the last decade.
An important note is that most funds implement a managed distribution policy based on the NAV – but for PEO, it is the “average month-end market price for the prior twelve months ended October 31.” The latest regular quarterly distribution amount has been $0.10 per quarter, working out to under 2% based on the latest market price.
Unlike most equity CEFs, investing in big oil names that deliver fairly substantial yields means that PEO can cover its regular payout through net investment income. Of course, it is that topping year-end distribution where the fund will then rely on capital gains to cover.
PEO Semi-Annual Report (Adams Funds)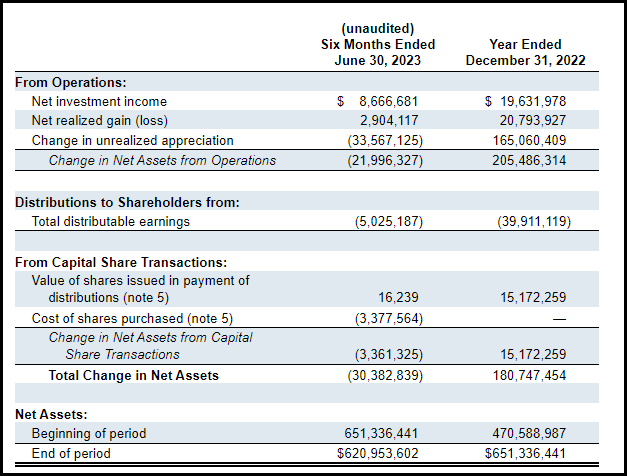
For tax purposes of the distribution, we see a similar breakdown as its coverage. A good portion of the distribution is ordinary income, and a large portion of the Q4 distribution is long-term capital gains for 2023. They stated that 99.1% of the ordinary income qualified as qualified dividend income, making it much more tax-friendly.
PEO Distribution Tax Classifications (Adams Funds)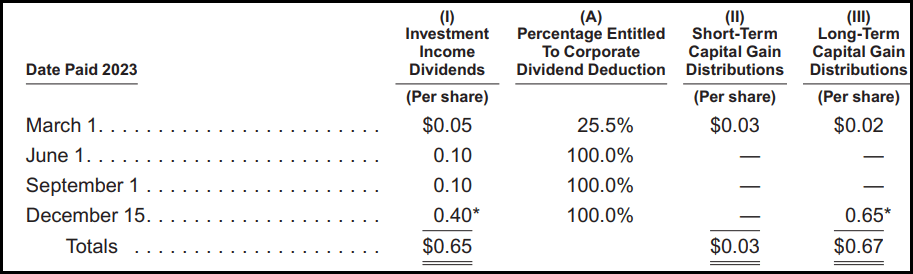
This makes sense, but as we have explored previously, this isn’t always the case for funds.
PEO’s Portfolio
The portfolio here is relatively boring. As we noted above, the fund is primarily invested in the largest energy companies in the world. PEO’s portfolio-weighted median market cap comes to around $70.5 billion. Exxon Mobil (XOM) and Chevron (CVX) take a commanding 30.9% allocation of the fund. When including ConocoPhillips (COP), it takes the top three holdings alone up to 38.4% of the managed assets.
PEO Top Ten Holdings (Adams Funds)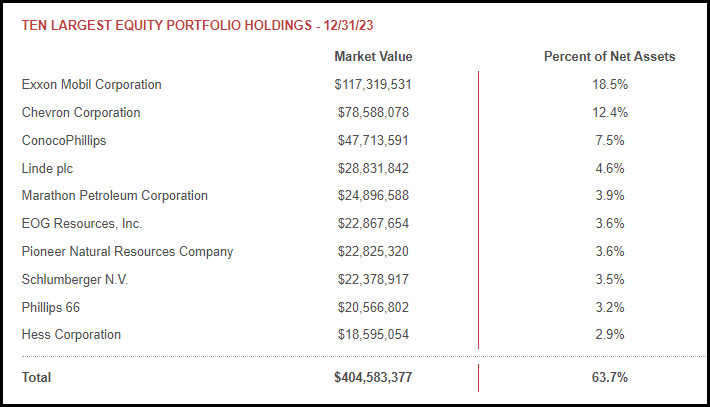
So there is definitely some concentration here, even if they list 57 total holdings overall. XLE itself is similarly weighted but takes it to an even larger extreme. XOM, CVX, and COP are the top three for XLE, but their weights account for nearly 50% of the ETF. It really is no wonder why we saw the performance between these funds come out so similarly in the past year.
At the same time, PEO’s average turnover rate in the last five years came to 25.38%. Even with that fairly active management, there doesn’t seem to be too much in the way of changes near the top overall. Thus, a relatively boring portfolio overall and somewhat of an XLE clone but at a discount and pays a managed distribution policy. At the same time, the biggest argument against PEO would be the 0.64% expense ratio. While that is much lower than the average CEF, it is still meaningfully higher than the 0.10% expense ratio of XLE.
That has likely led to some of the total NAV return performance divergence between the two instruments. Though XLE pulling away was primarily in 2022, as seen from the chart below. The total share price results were relatively closer.
YCharts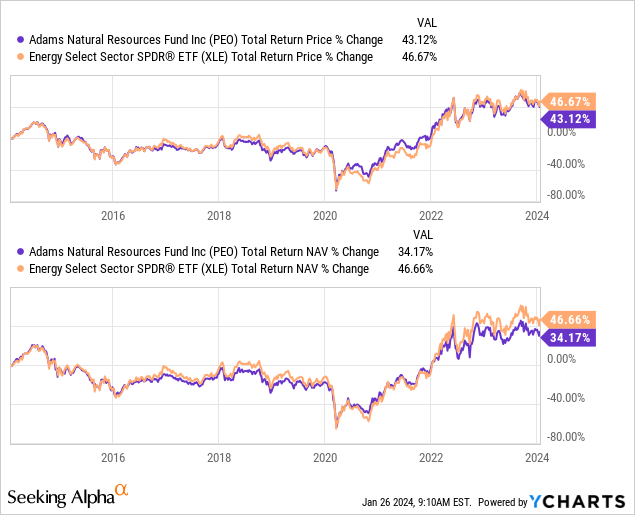
At the same time, while the holdings might mirror each other, the weighting differences would be another factor leading to performance divergences.
Conclusion
PEO doesn’t have the most exciting portfolio, but combined with the large discount, it could be a decent way to gain exposure to the energy space. They invest quite similarly to XLE itself but offer a managed distribution policy and a deep discount. With Saba showing some interest in the fund and building a fairly sizeable position, that could be a potential catalyst in the future for some discount narrowing.

 Q2 2024 Earnings Call Transcript")

