fotolinchen
Investment Thesis
STLD had announced its plans to venture into the aluminum sector with its USD 2.2 billion recycled flat roll mill project. The project would be funded internally as STLD had USD 2.3 billion of cash and short-term investments as of Sep 2023.
My valuation of STLD assuming no such aluminum project showed that it is currently fully priced. Any margin of safety must come from getting better returns from the aluminum project compared to keeping the USD 2.3 billion as cash and short-term investments.
I thus valued STLD using a sum-of-part approach for the steel and aluminum operations. For the aluminum project, I assumed that the STLD would achieve the same performance as the other aluminum companies. On such a basis, I found that there is no margin of safety at the current price. This is not an investment opportunity at the current market price.
Thrust of my analysis
I last covered STLD in Dec 2022 under “Steel Dynamics: The Margin Of Safety Is In The Aluminum Venture”.
STLD had announced its USD 2.2 billion aluminum venture that would generate between USD 650 million and USD 700 million of annual EBITDA on a through-cycle basis. The project was to be funded internally.
I thus valued STLD on a sum-of-parts basis comprising the value of the steel business and the value of the aluminum business.
STLD had USD 2 billion of cash and short-term investments at that juncture. I assumed that this USD 2 billion would be used to fund the aluminum venture. As such the value of this USD 2 billion to STLD is not the book value, but rather the value of the aluminum business.
I thus estimated that the Equity value of STLD to USD 131 per share as follows:
- In valuing the steel business, I assumed that it was a cyclical business and estimated its value over the cycle.
- In valuing the aluminum business, I assumed that the aluminum venture would achieve the same operating efficiency as the steel operations. Based on this I could then use the steel operations ratios to convert the EBITDA to EBIT and then to FCFF.
There has not been any fundamental change to STLD’s business direction since then. The current earnings are from the existing businesses and the aluminum venture is targeted to start operations only in 2025.
As such I will focus this article on the valuation of STLD. I will still value STLD using a sum-of-parts approach:
- I will update the value of the steel businesses on a through-cycle basis.
- I will value the aluminum business based on the performance of the aluminum sector rather than use STLD’s EBITDA projections.
There was a major acquisition by STLD in 2014 – the USD 1.6 billion Columbus flat-roll steel mill. As such I based my analysis from 2014.
Business background
STLD is one of the largest domestic steel producers and metal recyclers in the United States. The company has 3 reporting segments:
- Steel operations with the primary source of revenue from the manufacture and sale of steel products.
- Metals recycling operations that process and sell recycled ferrous and nonferrous metals.
- Steel fabrication operations that derive its revenue from the fabrication and sale of steel joists and deck products.
Steel operations are the biggest revenue contributor. Over the past decade, it accounted for about 2/3 of the company’s revenue (before intersegment elimination). This was followed by the Metals recycling operations with 23% of the company’s revenue. The balance came from the Steel fabrication segment and Others. Refer to Chart 1.
Chart 1: Segment revenue (Author)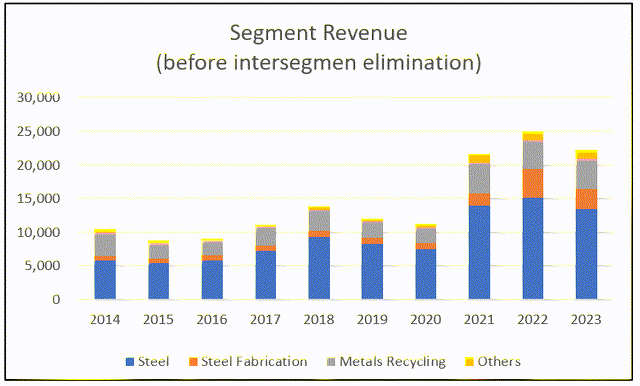
Note to Chart 1: The 2023 was extrapolated based on the Sep YTD performance.
STLD has a vertically connected business model. Over the past 10 years, the intersegment revenue averaged about 14% of the company’s revenue (before intersegment elimination). In 2022,
- The Metals recycling segment supplied 66 % of the ferrous tonnage for the Steel operations.
- 22 % of the steel for the Steel fabrication segment was sourced from the Steel operations segment.
The company touted the following benefits from this vertical integration:
- The Metals recycling segment is the largest supplier of recycled ferrous scrap to the Steel operations. This allowed STLD to manage companywide working capital, as lower scrap volume is required at its steel mills. STLD is also able to source higher-quality scrap for the steel mills, optimizing cost and quality.
- During weaker steel demand environments, its Steel fabrication operations can source more of its steel needs internally. During strong steel demand environments, it has the option also to purchase its steel needs externally.
Aluminum venture
The aluminum project comprised of:
- A USD 1.9 billion, 650,000-tonne low-carbon, recycled aluminum flat-rolled mill.
- Two supporting satellite recycled aluminum slab centers costing USD 0.35 billion.
The company will own over 94 % of the rolling mill facility through a joint venture arrangement with Unity Aluminum, Inc., whose employees provide significant aluminum industry operating expertise to the project.
The recycled aluminum flat-rolled mill is located in Columbus, Mississippi. According to the company, the location has several advantages such as excellent logistics, dependable natural gas and water sources, and access to ample renewable power.
The mill is expected to use approximately 50 % of its recycled aluminum slab onsite. The remaining amount is to be supplied to the 2 satellites’ recycled aluminum slab centers. These are new centers with one located in the Southwestern United States and the other in Northcentral Mexico.
The company believes this project is differentiated and supported by the following key advantages:
- STLD plans to bring the “mini-mill” culture and related operating efficiency to the flat-rolled aluminum industry.
- A significant number of its existing carbon steel customers also consume or process aluminum flat-rolled products.
- It diversifies STLD end-market exposure by serving the growing North American sustainable beverage can industry with its counter-cyclical characteristics.
The company’s metals recycling platform is expected to supply most of the scrap aluminum for these operations. This is in line with STLD’s business model of having significant vertical integration.
STLD Operating performance
From 2014 to 2023 STLD revenue grew at 9.2 % CAGR. On the other hand, net income grew at 45.5 % CAGR. These growths were due to a combination of volume growth and price growth. Chart 2 illustrates this for the Steel operations.
- Shipment volume grew at 5.5 % CAGR over the past decade.
- Average selling price grew at 4.0 % CAGR over the past decade.
You can see that there was a spike in the selling prices in 2021. You also notice that the shipment volume seems to move in syn with the average selling price. However, the correlation was 0.63 which is not very significant. But this characteristic is interesting as it suggests that in the downtrend leg of the cycle, both prices and shipment volume are affected.
Chart 2: Steel operations segment shipment and selling price (Author)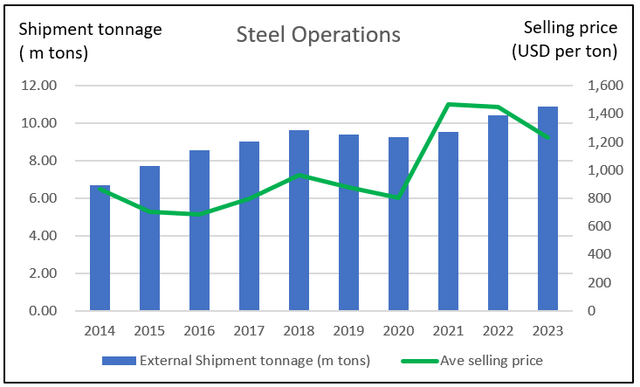
Note to Chart 2: The 2023 was extrapolated based on the Sep YTD performance.
Steel prices are cyclical and the 2021 price spike was the start of an outlier price situation over the next 2 odd years. This is illustrated in the top part of Chart 3. The bottom part of Chart 3 shows that aluminum prices.
You can see that aluminum prices are also cyclical and over the past few years, the steel and aluminum prices seemed to move in tandem. I will cover this in a bit more detail later in the risk section.
Chart 3: FRED Producer Price Index (FRED)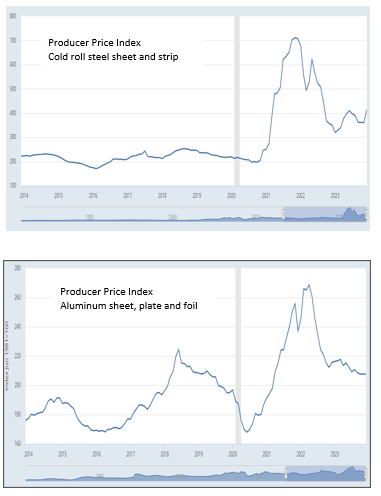
When I dug deeper into the operating profits (refer to Chart 4), I found the following:
- The increased sales volume and outlier prices from 2021 to 2023 had a very significant impact on revenue and profits.
- STLD business model is such that the fixed cost is only a small portion of the total costs. Over the past 10 years, the fixed cost averaged 9% of the total cost.
- A DuPont analysis showed that changes in the operating margin accounted for the bulk of the changes in the operating return.
- Even if you ignore the 2021 to 2023 performance, there was an uptrend in the contribution margin. It suggests improved operating efficiencies.
In line with the above, STLD delivered an average ROE of 25 % over the past 10 years.
Chart 4: Operating Profit and DuPont Analysis (Author)
Note to Chart 4:
a) I broke down the operating profits into fixed costs and variable costs.
- Fixed cost = SGA, R&D and Depreciation & Amortization.
- Variable cost = Cost of Sales – Depreciation & Amortization.
- Contribution = Revenue – Variable Cost.
- Contribution margin = Contribution/Revenue.
b) In the chart, the gap between the revenue and total costs (fixed costs and variable costs) represents the operating profit.
The key takeaways from the above analysis are:
- When modeling STLD revenue it may be more appropriate to project volume growth and assume that prices were “stable” based on the long-term average prices.
- The steel business is cyclical and any valuation should be on a through-the-cycle basis.
- It may be more appropriate to model STLD profits based on contribution and fixed cost.
US aluminum industry
The two primary methods for producing aluminum are primary production through the smelting of bauxite ore and secondary production using recycled aluminum scrap.
In the US, the primary producers are companies like Alcoa and Century Aluminum. US public listed secondary producers using recycled aluminum are companies like:
- Arconic Corporation (ARNC)
- Constellium SE (CSTM)
- Kaiser Aluminum Corporation (KALU)
- Novelis Inc. (that acquired Aleris Corporation in 2020). Novelis is now a subsidiary of Hindalco Industries Limited, India’s largest non-ferrous metals company.
In the context of obtaining publicly available information on the aluminum sector, we only have the first 3. I covered these 3 companies a few months ago and pulled together the information as follows:
- Chart 5 shows the operating profit trends for the 3 companies in the same format as the left part of Chart 4.
- Table 1 shows the relative performance of these 3 companies for some key metrics. I would use the data of these panel companies for my valuation of the STLD aluminum business.
Chart 5: Aluminum companies operating profit (Author)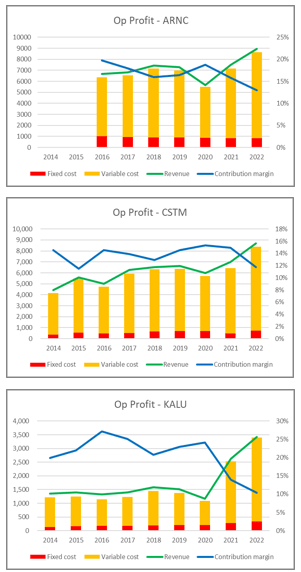
Table 1: Key Performance Metrics of the Aluminum Companies (Author)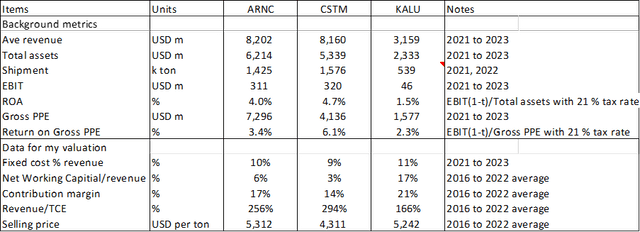
Note to Table 1: The top half of the table are metrics to show the size and returns. The bottom half of the table contains those metrics that would be used in my valuation of the STLD aluminum business.
I would like to highlight the following differences when comparing the performance of these 3 companies with STLD.
- The average 2021 to 2023 Operating ROA (defined as NOPAT/total assets) for the 3 aluminum companies ranged from 1.5 % to 4.2%. In contrast, STLD achieved 24.0 % for the same period.
- STLD had an average contribution margin of 23% from 2016 to 2022. This is much higher than those achieved by the 3 companies that ranged from 14 % to 21 %.
We are of course comparing different industries but it makes you wonder whether STLD is diversifying into a less profitable sector.
The other concern that I have is the expected increase in production capacity as illustrated below.
“Three greenfield aluminum sheet rolling mills could join the US market over the next three years…cumulatively bring nearly 2 million mt of capacity online… and each mill is going to emphasize scrap consumption in its raw material mix… Each company emphasized the surging beverage can industry as an anticipated key end market…” S&P Global Jan 2023
The major aluminum mills that had announced their expansion plan over the past 2 years included Novelis, STLD, and Ball, a leading global provider of infinitely recyclable aluminum beverage packaging.
Valuation of STLD (without the aluminum project)
I valued STLD based on the single-stage Free Cash Flow to the Firm (FCFF) model. I looked at 2 Scenarios:
- Scenario 1 – This is my expected one where the volume is based on the past 3 years’ average volume. The price, contribution margin, and capital turnover (revenue/TCE) are the respective 2014 to 2023 average cycle values.
- Scenario 2 – This is an optimistic one where the volume, contribution margin, and capital turnover are based on the past 3 years’ average values. But the price is based on the 2014 to 2023 average. While still a through-the-cycle price, I assumed that there are improvements in the contribution margins and capital turnover.
The results are summarized in Table 2. You can see that there is no margin of safety under both scenarios.
Table 2: Summary of valuation (without the aluminum project) (Author)
Single-stage valuation model
For my valuation above, I used the Free Cash Flow to the Firm (FCFF) model as shown in Table 3.
Value of the firm = FCFF x (1 + g) / (WACC – g)
FCFF = NOPAT X (1 – Reinvestment rate)
NOPAT = (Revenue X Contribution margin – Fixed costs) X (1 – tax rate)
Revenue = Shipment volume X Selling Price
Reinvestment = growth / Return
Return = NOPAT / total capital employed
Value of Equity = Value of the firm + Cash – Debt – Minority Interests
Table 3: Sample calculation of steel business (Author)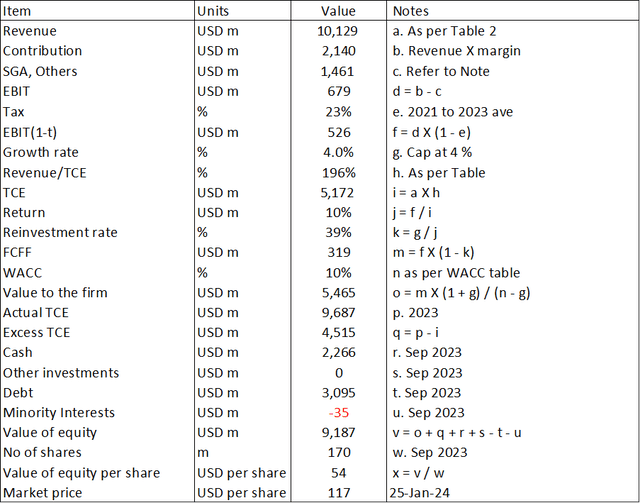
The WACC used in the model was derived based on the first page results of the Google search for the term “STLD WACC”. Refer to Table 4.
Table 4: WACC (Various)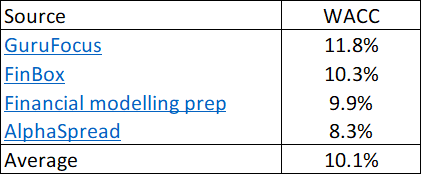
Valuation of STLD with an operating aluminum business
This is a sum-of-parts valuation where:
Value of the firm = value of the steel business + value of the aluminum business
The value of the steel business is what I have done earlier.
The value of the aluminum business is based on 2 Scenarios with the key metrics shown in Table 6.
- Scenario 3 – I assumed that STLD would ship 80% of its capacity with the panel average selling price as shown in Table 1. The other metrics were based on the average values of the panel as shown in Table 1.
- Scenario 4- This is an optimistic one. I assumed that STLD would ship 90% of its capacity with the panel average selling price. The other metrics were based on the best of the panel companies.
I then looked at the various combinations of the steel business and the aluminum business. I next estimated that the value of STLD based on a sum-of-parts basis for each of the combinations. These results are summarized in Table 5 while the details are presented in the subsequent sections:
Table 5: Sum-of-parts value of STLD (Author)
You can see that the best value for STLD is USD 113 per share. Given the market price of USD 117 per share, I would conclude that the market has already priced in the success of the aluminum venture.
Aluminum valuation model
My valuation model for the STLD aluminum business is similar to that for the steel business. The main difference is that I do not have any STLD historical data. As such I assumed that STLD performance would be similar to those of the panel that was shown in Table 1.
The key metrics and values under the 2 Scenarios are summarized in Table 6
Table 6: Key metrics for valuing the aluminum business (Author)
A sample calculation for the aluminum business is shown in Table 7. Most of the items are self-explanatory except for item p.
Item p is the total capital required for the aluminum business. I deduced that this would be equal to the capital cost of USD 2.2 billion and the additional net working capital required. I estimated the new working capital based on the panel’s new working capital to revenue ratio.
Table 7: Sample calculation of the aluminum business (Author)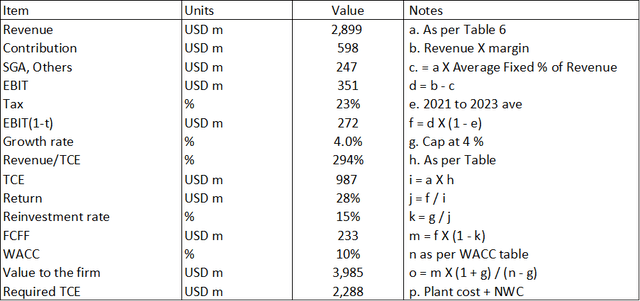
Sum-of-parts valuation
Table 8 illustrates how I determined the sum-of-parts value shown in Table 5. Most of the items are self-explanatory except for the following:
Item ae = This is the total capital required for both the steel and aluminum businesses. This equals the sum of item i of Table 3 and item p of Table 7.
Item ag = I assumed that all the USD 2.3 billion cash is used up to fund the aluminum venture.
Item ai = In addition to the Sep 2023 debt, I assumed that there would be additional debt as the capital required for the aluminum project (item p in Table 7) may be more than the USD 2.3 billion cash in certain Scenarios.
Table 8: Sample calculation for sum-of-parts valuation (Author)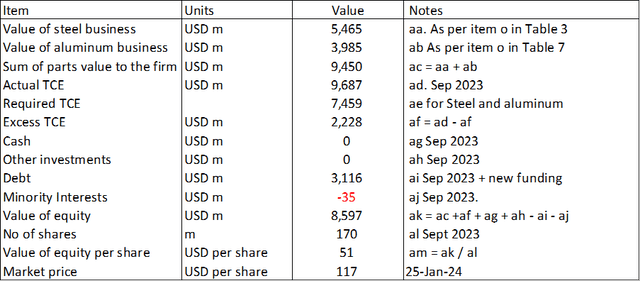
Risks and limitations
There are 2 key issues in my valuation of STLD.
- Assumptions about the aluminum business.
- Same WACC
Except for the EBITDA projections, STLD had not shared much information about the earnings of the aluminum project. I am sure that they would have carried out their assessment of the potential sales and operating efficiencies.
In its July 2022 announcement of the project, STLD stated:
“The North American flat-rolled aluminum industry has a substantial and growing supply deficit estimated at over 2.0 million tonnes, based largely on increasing demand from the automotive and sustainable beverage can industries.”
I have earlier mentioned that in addition to STLD, other manufacturers are adding capacity that altogether totaled 2.0 million tonnes. The new added capacity may have negated many of the benefits and advantages when STLD first announced the project.
Along this line, in my best case scenario for STLD’s aluminum business, I had assumed 90% capacity utilization. This may be an overly optimistic view.
Next, while I used the aluminum panel data, I worry that my valuation of the STLD aluminum project is very optimistic. For example, if you refer to Table 7,
- You can see that the projected EBIT(1-t) is USD 272 million (item f).
- My projected TCE or total capital employed (item p) was USD USD 2.3 billion.
- If I equate this TCE to the assets, the ROA would be about 12%. This is very much higher than the panel ROA of 1.5 % to 4.7 % as shown in Table 1.
According to Damodaran, the WACC is a way to bring risk into the valuation. A high WACC represents riskier cash flows. I have used the same WACC for the steel and aluminum businesses.
Given the STLD steel track record, I would say that the aluminum venture is riskier than the steel business. As such I should use a relatively higher WACC to value the aluminum business. I did not and this meant that my valuation was an optimistic one.
I had earlier mentioned that aluminum prices are cyclical and seemed to have moved in tandem with steel prices. So instead of reducing the steel price cycle risk, it will amplify the risk. I have not reflected this in my WACC.
Given the above uncertainties, we should seek at least a 30% margin of safety. There is no such margin here.
Conclusion
STLD has about USD 2.3 billion in cash as of Sep 2023 and this is equivalent to the CAPEX for the aluminum project.
When I valued STLD treating this cash as non-operating, I obtained a value of USD 116 per share. Based on the market price of USD 117 per share, there is no margin of safety.
The question is whether the aluminum project’s cash flow is such that its present value would be greater than the RM 2.2 billion spent. To answer the question, I modeled the STLD aluminum business based on the performance of 3 public-listed aluminum companies.
Unfortunately, even assuming that STLD achieved the best performance of these 3 reference companies, I could not get a higher value than that treating the cash as non-operating assets. In other words, there is no margin of safety with the aluminum project.
To have at least a margin of safety, STLD aluminum operations must achieve a performance that is significantly better than what the reference companies have achieved.
STLD is relying on its steel track record for this. My view is that the aluminum sector looks tougher than the steel sector. There is too much uncertainty at this stage to invest in STLD at this price.


