jxfzsy
Of all the different investment strategies covered by the ETF space, fully quantitative ones are some of the rarest. The majority of ETFs have a clear focus – track an index, focus on a sector, invest with a defined strategy. Quantitative funds flip that view on its head and instead rely on trading strategies that were back tested to be successful on average, and then implement them in a totally mechanical and algorithmic way. In fact, this is a lot more reminiscent of the hedge fund space where quantitative strategies are more prevalent and giants like D.E. Shaw and Renaissance Technologies have a storied reputation of employing Ph.D.’s from math, physics, and similar fields to create complex trading algorithms that generate returns in ways impossible to achieve at home. These funds are often black boxes in terms of their specific strategies and holdings because a lot of the alpha is in the code, and keeping the code and execution as confidential as possible is the funds’ best way to ensure future success.
So when a somewhat similar investment strategy appears in the form of an ETF, we were quite curious to explore it further. The Simplify Multi-QIS Alternative ETF (NYSEARCA:QIS) was just launched in July 2023 and has a lot of interesting characteristics that could potentially make it a good portfolio diversifier. However, with little information to currently go off of, and more importantly a track record that’s very short, we have to rate this a hold for now.
What’s in the box?
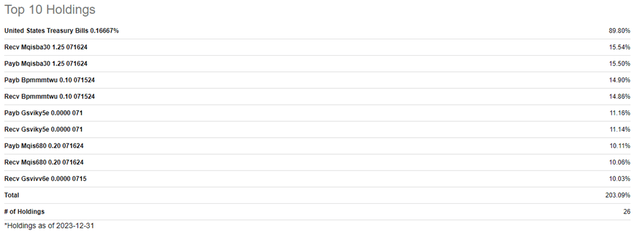
QIS’s mission statement is to provide positive absolute returns and income by investing in a diversified portfolio of multiple quantitative investment strategies across different sectors. We’ll break down what the fund does on a higher level, but want to immediately preface that looking at the holdings doesn’t help give a sense or snapshot of what the ETF does. Here are the holdings, which are inscrutable besides the T-Bills:
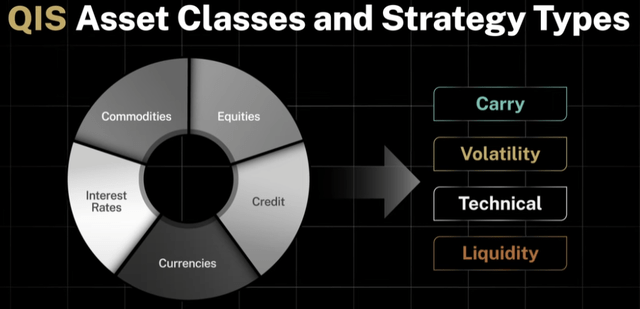
Instead, here are the strategy types that QIS employs, and the asset classes they are applied to.
The asset classes are self-explanatory, but here is a quick explanation of each of the strategy types.
- Carry: return generated from the difference between spot and futures prices. Can also be multi-leg by borrowing a low carry asset and lending a high carry one.
- Volatility: the market’s expectation of risk, reflected in option prices. Includes all strategies that profit from volatility rising, declining, or remaining constant based on current conditions.
- Technical: identifying opportunities with statistical information from trading activity such as price movement and volume.
- Liquidity: opportunities around anticipated market liquidity buying/selling events such as buying securities in anticipation of their addition to a popular index, trading around options roll-over and expirations, and trading around technical support levels.
By applying these four strategy types to the five asset classes, QIS has up to 20 strategies to include at any given moment. To ensure diversification, at least one instance of each strategy and asset will be included in the final portfolio. The portfolio management team continuously monitors the mix of strategies and makes changes if they believe it would improve the portfolio.
A peek at performance
Here is the performance of QIS since its inception.
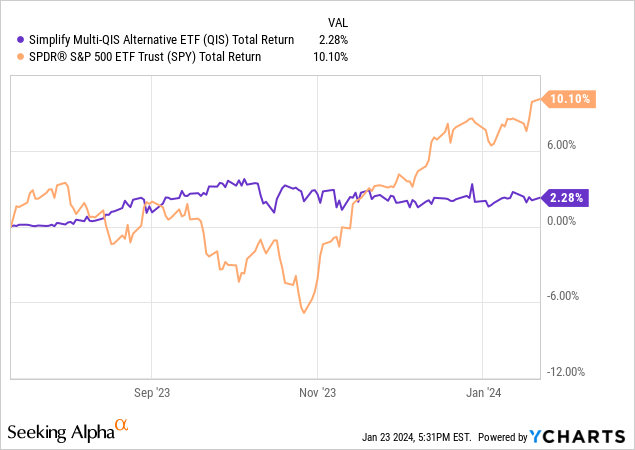
So far, QIS is delivering on its goal of being uncorrelated with the general markets. We see it has more or less steadily made its way up to a total return of 2.28% while the S&P 500 has danced all over the place. QIS targets an annual standard deviation of 8-10%, which it also looks on track for based on the price action.
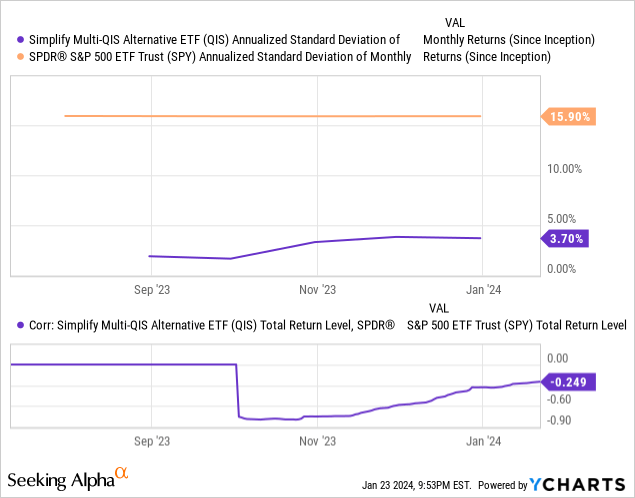
We can chart the annualized standard deviation and the correlation to the S&P for a visual representation of those figures. Although there is very little price history so far and these charts should be revisited down the line, even with sparse data they begin to show the results we expect – significantly lower volatility and a correlation to the general markets that is zero or even negative at times.
Summing up the unknowns
Another factor in deciding the attractiveness of this ETF is its relatively high expense ratio of 1.00%. While we typically prefer to focus on net returns instead of getting caught up with the expense ratio, a fund that sets out to produce modest returns with low volatility can find itself highly impacted by the fees.
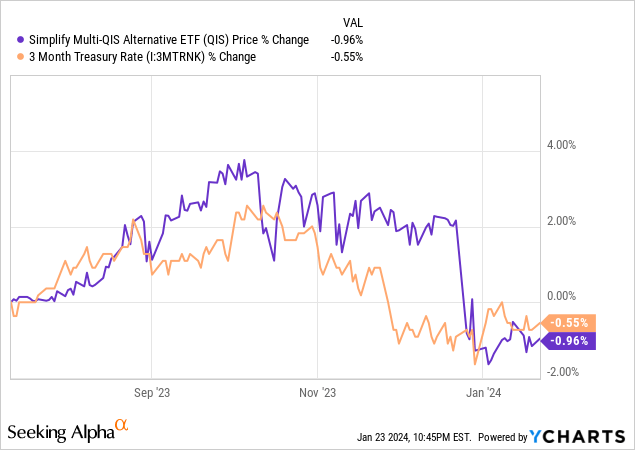
QIS lists the 3-month T-Bill as a benchmark, and while the performances here look a lot more similar, a 1.00% expense ratio can materially be the difference in beating that benchmark or not.
You also have to be comfortable not knowing exactly what you’re holding. The reality is that if the portfolio managers do a good of balancing the strategies to be uncorrelated with equities and bonds, there shouldn’t be a need to majorly adjust the rest of an individual’s portfolio to account for the addition of QIS. But for someone more involved who enjoys reading quarterly updates and performance reviews, you’ll be hit with bewildering lines such as “During 4Q, the returns were slightly negative at -0.19%. Underperformance in the strategies, alongside fees, was the main cause of this” (4Q23 Performance Review). To their credit, they then give five more sentences of actual explanation (above-average correlation reduced effectiveness of diversification), but this is still extremely abstruse as far as explanations and reviews go.
QIS: one to watch, but hold rated for now
All of this combines into a hold rating for us, but at the end of the day it’s still encouraging to see new strategies make their way into the ETF space. More options for ETF investors, especially strategies that were historically kept behind a hedge fund structure, is not a bad thing.
We’re curious to see how QIS performs over time and whether it will be able to check off our primary concerns: maintaining consistently low volatility and correlation, generating enough net return to justify the fees, and no matter how unlikely, offering slightly more transparency into its entire process.
