Yagi Studio
Investment Thesis
Gildan Activewear (NYSE:GIL), a vertically integrated apparel manufacturer, demonstrates solid performance with a capital-light structure and a competitive average ROCE of 11.8%. Despite facing industry challenges, the company has gained market share, boasting consistent margin growth and a robust balance sheet. Trading below the sector median at an EV/EBITDA of 10.28x, Gildan appears attractively priced, supported by a favorable comparison with peers like Hanesbrands (HBI). Catalysts include a strong value proposition, expected input costs deflation, and new leadership; while risks include intense competition and macroeconomic conditions.
Company Description
Founded in 1984, Gildan Activewear (“the company”) is a vertically integrated manufacturer specializing in everyday basic apparel with a product range including activewear, underwear, and hosiery items. The company distributes its products globally, catering to wholesale distributors, screen printers, embellishers, and retailers primarily in North America.
At the core of Gildan’s mission is the commitment to:
We create value for customers by delivering superior quality products for the whole family at everyday low prices
Business Performance
Gildan Activewear is a capital-light (i.e., EBITDA factor of 1.22x TTM) business that delivered an average ROCE of 11.8% over the last four years, impressive, but below the S&500 one of 18.0%
Author’s Estimates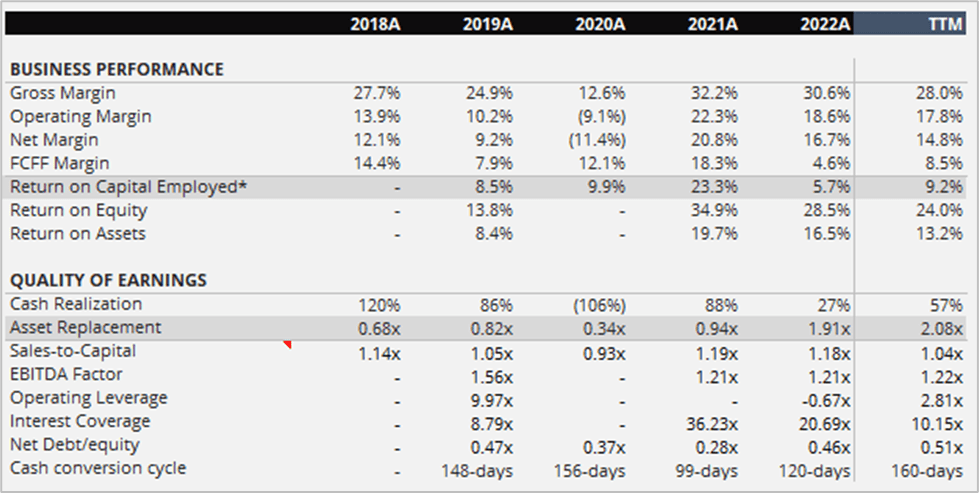
Income Statement
Over the last 5 years, the top line experienced a CAGR growth of 2.7%, above the market growth of ∿ 0.93% resulting in a gain of market share from approximately 0.93% to 1.0% relative to its total addressable market, namely the Apparel market. The increase in market share was primarily attributed to the company’s value proposition of delivering high-quality products at the most competitive prices.
Statista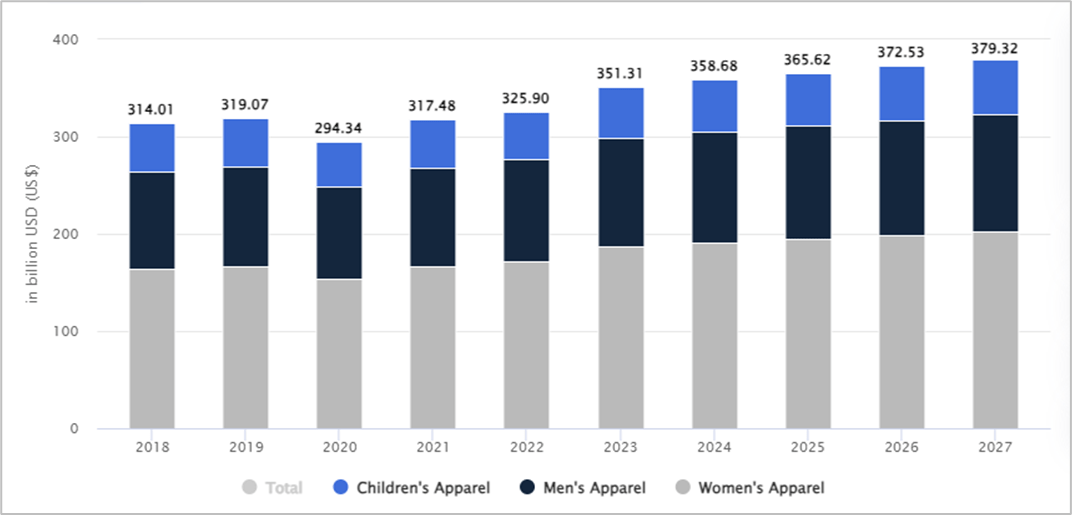
On the margins side, the picture is a little bit different but still positive.
Author’s Estimates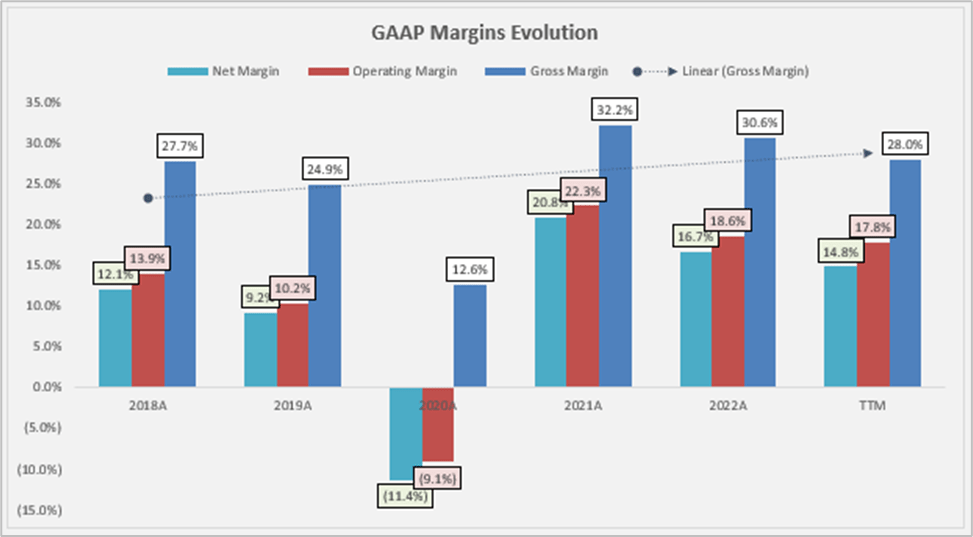
The chart demonstrates consistent margin growth in the business, except for the 2020A COVID period. This growth resulted from a blend of cost efficiencies and economies of scale, reaching a peak in 2021A. However, the company’s bottom line has faced challenges recently due to factors like increased raw material and manufacturing input costs, coupled with an unfavorable mix in fleece sales. Fortunately, some of these challenges, such as high input costs, are expected to turn into favorable conditions in 2024, as we likely approach the peak of the price cycle.
Balance Sheet
The balance sheet remains robust, boasting an Interest Coverage ratio of 10.15x TTM. However, there is a noteworthy increase in the cash conversion cycle, standing at 160 days TTM, surpassing the historical four-year average of 131 days. This is primarily driven by a lower inventory turnover, currently at 191 days compared to the historical four-year average of 165 days.
Interestingly, the decline in inventory turnover does not appear to be company-specific; rather, it affects many players in the industry due to ongoing consumer pressures. For instance, Hanesbrands, one of Gildan’s competitors, presents a similar deteriorating picture on the inventory turnover side, with inventory turnover at 129 days TTM.
Author’s Estimates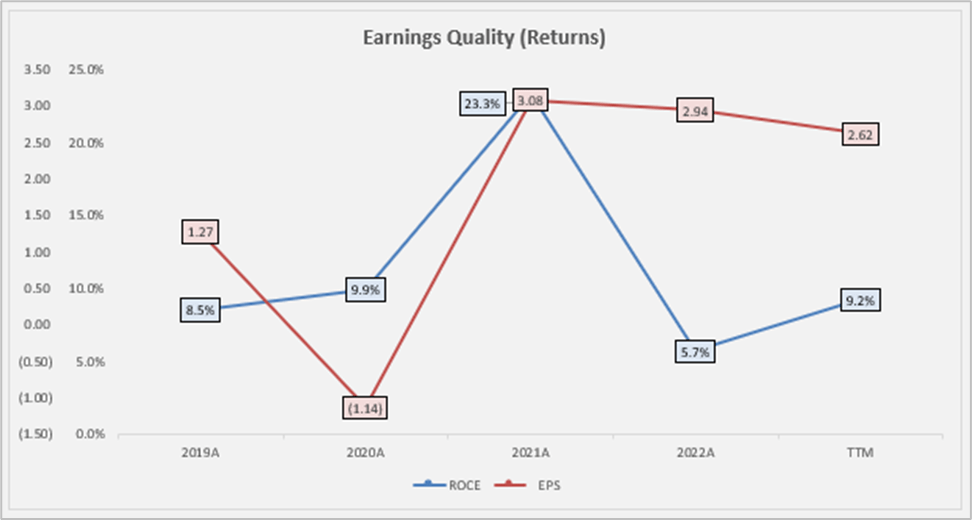
On the performance front, ROA is returning to the historical norm and currently stands at approximately 13.2%. Meanwhile, ROE is around 24.0%, exceeding the cost of equity at approximately 13.2%, albeit down from 28.5% in the previous year. This decline is attributed to the margin contraction, due to the factors underlined above, and lower total asset turnover but in line with the 5-year average.
Cash Flow Statement
The business is cash-flow generative with a current FCFF margin ∿of 8.5% TTM, below the 5-year average of 11.4%
Author’s Estimates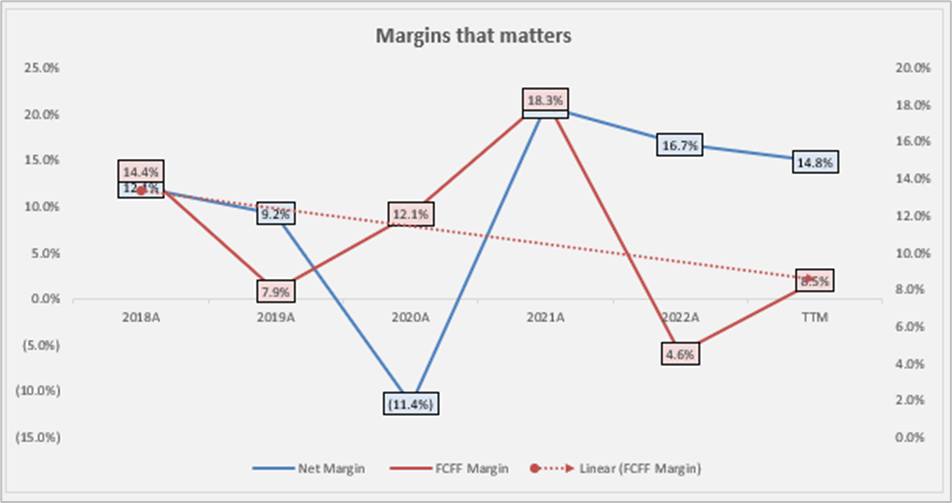
The cash conversion stands at ∿57.3%, CFO-to-Net-Income at 1.07x (vs 5-year average of 0.57x), and FCFF yield at ∿4.0% TTM. In particular, the FCFF yield is very attractive as it is above the SPY median FCFF yield of ∿ 3.7%.
In relative terms, when comparing the FFCF trends of Gildan with that of its closest peer, Hanesbrands, it presents not only a better ability to generate cash flows (i.e., FCFF margin of ∿ 11.4% vs Hanesbrands’s FCFF margin of ∿ 10.1%) but also a more robust one.
Author’s Estimates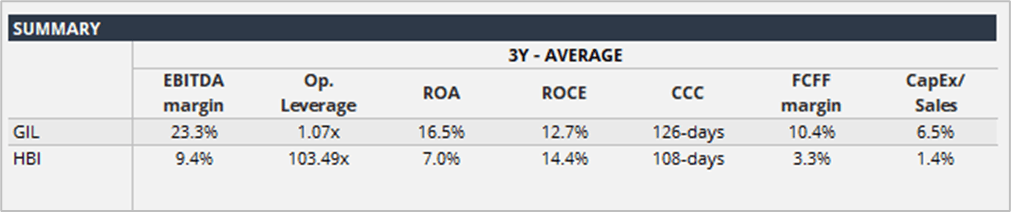
Above, you can see represented a quick comparison of the two.
Valuation
Gildan Activewear trades at an EV/EBITDA of 10.28x, below the sector median EV/EBITDA of 10.79x and below what I consider its closest peer Hanesbrands, which is trading with an EV/EBITDA of 15.56x TTM. Unfortunately, other peers that would fit in the basket for comparisons (i.e., Gildan’s competitors) like Fruit of the Loom (a Berkshire Hathaway (BRK.A) (BRK.B) subsidiary) or Renfro Corporation are not publicly traded companies.
SeekingAlpha.com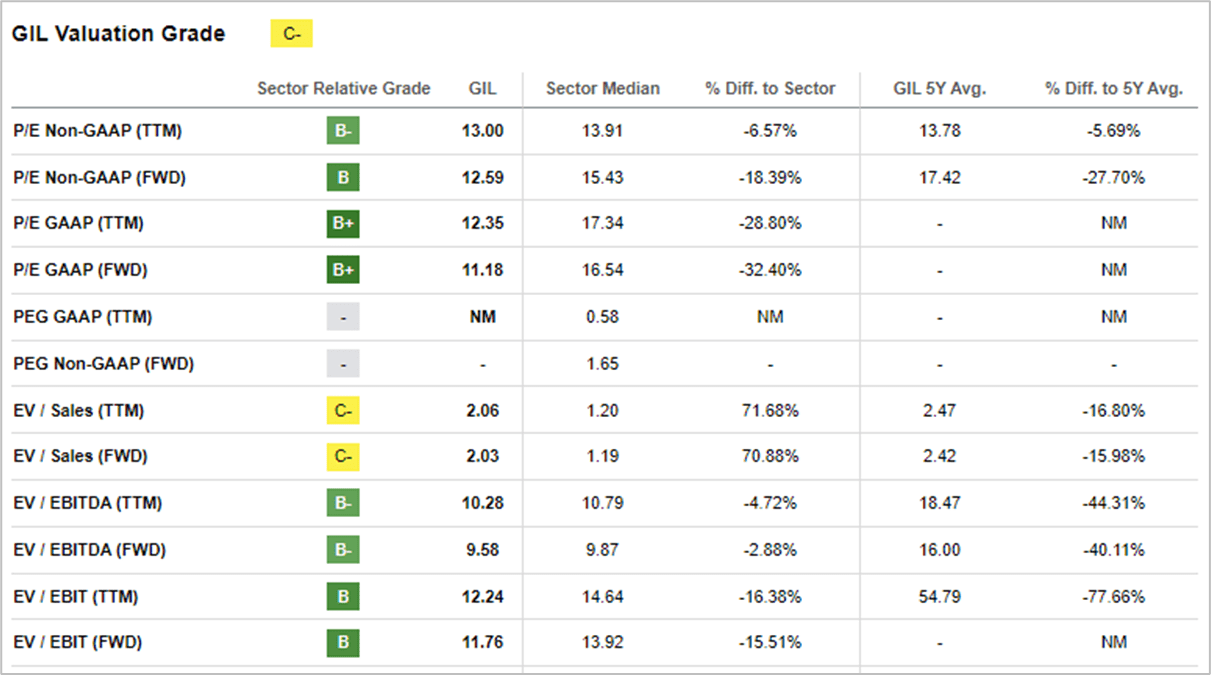
Meanwhile, from a historical perspective, we have the following.
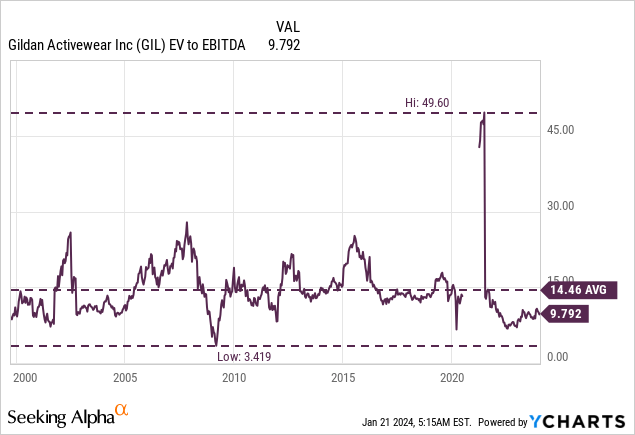
In my opinion, the company is very attractive, not only from the EV/EBITDA perspective but also from the FCFF yield perspective. On consensus estimates, Gildan is currently trading at ∿ 9.58x 2024E EV/EBITDA, in my opinion, it should trade at 11.00 EV/EBITDA (or a 5-year average EV/EBITDA ex COVID-year), which translates into a price target of $44.85/share.
Catalysts
In my opinion, the following should represent a potential tailwind:
- Value Proposition – The company’s competitive edge in providing high-quality products at a notably lower price (approximately 20%-25% below industry peers) and with the best lead times positions it for continued market share expansion in the future. The value proposition is further strengthened by Gildan’s new low-cost facility in Bangladesh, where the exit capacity rate is expected to reach 75% by the end of 4Q24, enhancing the company’s competitive position.
- Input costs deflation – With the majority of input costs peaking in the cycle, what was a headwind in 2023A is expected to transition into a tailwind in 2024E, potentially fueling additional margin expansion.
- Management – The newly appointed CEO, Vince Tyra, is poised to enhance the company’s financial performance and restore market confidence. Tyra’s track record underscores successful leadership in the apparel industry, notably in revitalizing businesses and achieving significant revenue growth.
- Multiples expansion – The company has communicated its intention to repurchase approximately 5% of its shares annually.
Risks
In my opinion, the following can represent potential headwinds:
- Competition – The basic apparel market is characterized by intense competition, with segmentation based on factors such as price, quality, and style.
- Macroeconomic backdrop – Across Australia, Europe, and the United States, the prevailing macroeconomic conditions continue to exert pressure on consumer demand, leading to a more cautious approach in wholesaler ordering than initially anticipated. Notably, the activewear segment faces heightened challenges due to both subdued consumer demand and an excess of inventory in the channels.
- Global minimum tax rate of 15%
- Manufacturing concentration – The manufacturing concentration in Honduras makes the operations susceptible to hurricanes.
Final Remarks
Gildan Activewear presents an attractive investment opportunity with a compelling valuation, strong cash flow generation, and potential catalysts for market share expansion and margin improvement. While risks exist, the company’s competitive edge, coupled with the expertise of the newly appointed CEO, makes it a promising investment with a target price of $44.85/share. To make sure that the company is going in the right direction, investors should monitor industry trends, macroeconomic conditions, and the successful execution of strategic initiatives by the management team.

 Q2 2024 Earnings Call Transcript")

