Artur Didyk/iStock via Getty Images
Thesis
Devon Energy (NYSE:DVN) has had it rough lately, down 8% to start the year after being down over 30% in 2023. I have written several bullish articles on DVN over the course of 2023 and the stark difference in price performance between it and peers is puzzling. To challenge my convictions, I decided to do a comparison with Diamondback Energy (NASDAQ:FANG), another company I’ve previously covered, and Devon Energy to determine if I should consider a shake-up of my portfolio.
In this article I will compare, head-to-head, two middle weight companies of the Permian Basin. The winner will be based on the following metrics for both Devon Energy Corporation and Diamondback Energy.
- Dirt – a measure of the physical asset we are investing in. Whoever has the best acreage should (over the long haul) provide the best returns.
- Debt – a measure of overall management performance and forward flexibility.
- Dividends – which company has the best shareholder return model.
- Dollars – a measure of overall valuation
A Quick Look
Before we get started, let’s take a look at each company. Both DVN and FANG have similar business models as independent oil and gas producers. Diamondback operates mostly in the Midland Basin with 85% of production coming from this area and 15% coming from the neighboring Delaware Basin.
FANG Acreage Map (Q3 Investor Presentation)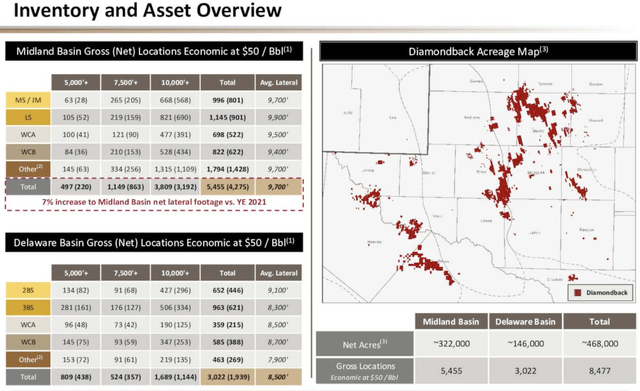
Devon is slightly more diverse pulling production from multiple basins. Devon produces roughly 67% of its output from the Delaware Basin The rest of its production is sprinkled amongst the Eagle Ford, Anadarko, Powder River, and Williston Basins.
Devon Energy’s Delaware Acreage (DVN Q3 Earnings Presentation)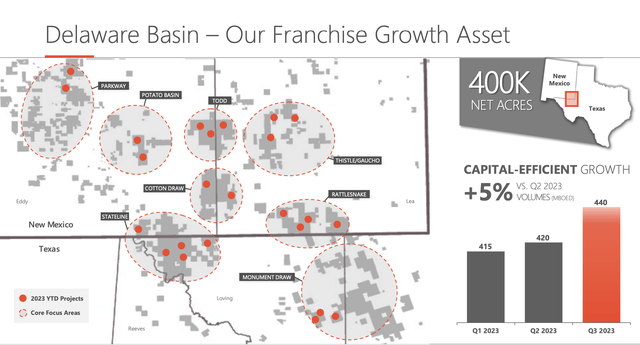
Both companies’ cash flows are derived from commodity prices. Due to the volatility this can create, both companies have created a variable shareholder return model. Both companies are nearly identical in terms of market cap ($26 billion) and Permian production. DVN produces 440 MBOE/d out of the Permian while FANG tips the scale at 453 MBOE/d. After accounting for all of its assets, DVN is the largest producer at roughly 665 MBOE/d.
DIRT
Ultimately when investing in an oil/gas producing entity, we must remember that the quality of property they own will be the limitation to their success. Poor quality wells will produce poor financial returns. The main focus of this discussion will compare and contrast the Midland Basin and the Delaware Basin, both of which are located in West Texas and Southern New Mexico.
Depth Profile of the Midland and Delaware Basins (Search and Discovery Article #10412)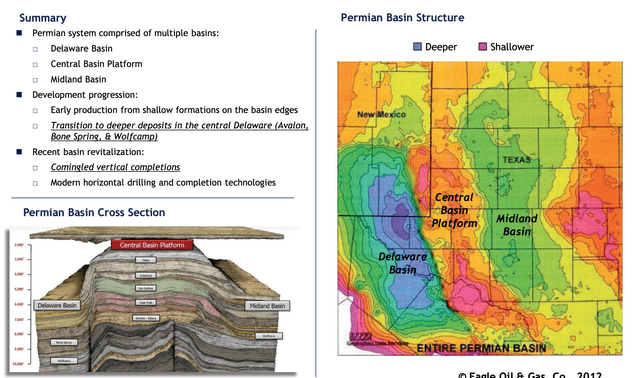
Midland Basin
The Midland Basin is Diamondback’s bread and butter and has been able to produce excellent results. The Midland Basin is located just east of the Delaware Basin. One of different physical aspects of the Midland versus the Delaware is that the Midland Basin is in the ballpark of 2,000 ft shallower to the oil producing layers of the basin such as the Wolfberry or the Wolfcamp.
This gives Diamondback a distinct cost advantage, having to drill through 2,000 less feet of rock to reach their product. Diamondback uses this advantage to yield one of the lowest production costs per BOE in the industry. Since FANG also produces in the Delaware basin, the company is able to produce cost figures for both basins. As you can see in the image below, a well in the Delaware basin cost over $300/lateral foot more to complete. With an over 10,000 ft lateral well, this cost difference can be significant, to the tune of $3 million per well.
FANG drilling costs (Q3 Investor Presentation)
Delaware Basin
If it’s easier to get to the oil and gas products in the Midland Basin, why on earth would someone bother drilling in the Delaware Basin? Being 2,000 feet deeper isn’t necessarily ALL bad. The additional rock overhead creates more pressure and thus more oil can be extracted per well. This does create the potential for higher ROIs if the wells are drilled and executed correctly. The juice needs to be worth the squeeze.
Delaware Vs. Midland Basin Properties (Search and Discovery Article #10412)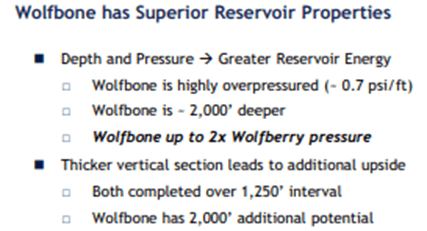
Devon has noted some operational impacts as a result of infrastructure constrains in the underdeveloped portions of the Delaware basin.
Our plan will shift a higher mix of activity to multizone Wolfcamp developments in New Mexico, which is the core of the play as infrastructure constraints have eased over the past and will continue over the coming months. With this refined capital allocation, we expect to improve well productivity by 5% to 10% in 2024
The 2023 infrastructure constraints resulted in a shifting a portion of our capital to less prolific areas in the basin and at times, constrained peak rates across a subset of our new wells.
Transitioning to higher quality wells should allow DVN to profit from lower operating cost per BOE in 2024.
The Verdict
There are obvious pros and cons between the two basins, however all this comes down to which company can turn the highest return on investment. The table below represents the average realized price per BOE for both companies as well as their operating costs bases on Q3 performance. All data is obtained from each company’s Q3 10-Q reports.
Diamondback scores the point for the best acreage thanks to a higher realized price and lower overall operating cost structure to deliver a sizeable increase in operating margin. The score is 1-0 FANG.
Investors should note that I expect the gap in operating expenses to narrow going forward. As previously mentioned, DVN’s costs should decline by shifting to higher quality wells. Additionally, FANG will incur higher operating costs following the divesture of its stake in its water infrastructure, Deep Blue JV. This will result in operating expenses rising approximately $0.50/BOE going forward.
| % Oil Production | Realized Price per BOE | Operating Expense | Operating Margin | |
| Devon Energy (DVN) | 48.3% | $46.92/BOE | $12.19/BOE | $34.73/BOE |
| Diamondback Energy (FANG) | 58.8% | $54.37/BOE | $10.51/BOE | $43.86/BOE |
Debt
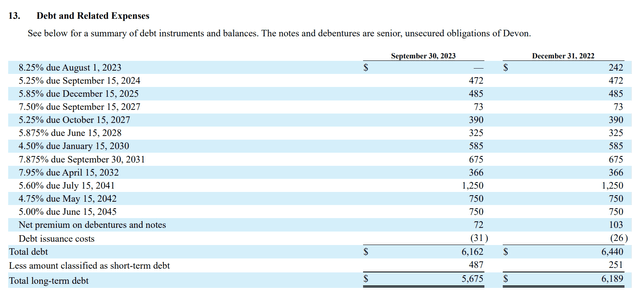
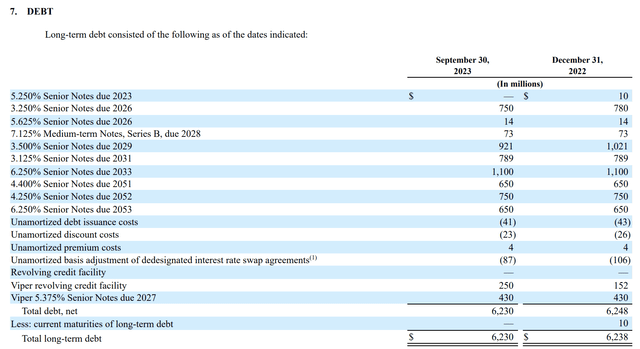
To measure the work of the management team, we must evaluate the financial condition the company is operating under. We will compare the debt profiles of both companies for out next metric.
Two distinct differences can be seen here.
1. The average cost of debt for FANG is 4.57% vs 5.72% for DVN.
2. DVN has $957 million in debt due between both 2024 and 2025. Meanwhile, FANG has no maturities due until 2026.
The total debt due over the next 5 years is essentially the same between the two companies but DVN’s has a steadier cadence. FANG investors will benefit from higher returns in 2024 and 2025 that are not impeded by debt maturities.
However, this will allow DVN to have a more structurally sound balance sheet entering 2026 as the company plans to pay off the debt as it comes due instead of pursuing refinancing options. Devon’s CFO, Jeff Ritenour, laid out the companies plan in the Q3 conference call.
In August, we paid off $242 million of maturing debt, and we bolstered liquidity with cash balances increasing by 56% to $761 million.
With these actions, Devon exited the quarter with a net debt-to-EBITDA ratio of just over 0.5 turn. Moving forward, we plan to add to our financial strength in each quarter by committing around 30% of our free cash flow back to the balance sheet. This will allow us to further pare down our absolute debt balance with repayment of roughly $1 billion of maturities coming due in 2024 and 2025 and maintain a minimum cash balance in excess of $500 million.
With a lower cost of debt and two years of zero debt obligations the point for debt goes to Diamondback. The score is now 2-0.
Dividends
Both companies’ return profile is split into two parts. A base dividend and a variable component. The variable component can be either in the form of a variable dividend or share repurchases, or some combination of both. The variable component is intended to match the variability of energy prices.
DVN targets to allocate 70% of FCF to shareholder returns while devoting the remaining 30% to the balance sheet. This 30% will mainly be used to address the 2024 and 2025 maturities mentioned earlier. FANG follows a similar model but allocates a minimum of 75% of FCF to shareholders under its program.
DVN Shareholder Returns (DVN Q3 Earnings Presentation)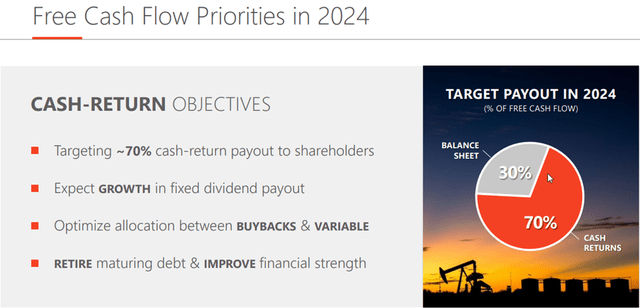
Despite the lower target, DVN has returned 102% of FCF over the first three quarters of 2023 as a result of heavy share repurchases in Q1. FANG also exceeded its target by paying out approximately 81% over the same time frame. However, with superior operating margins and a higher minimum payout, FANG shareholders should receive a higher overall compensation in the long run. The score is now 3-0 in favor of Diamondback Energy.
FANG Shareholder Returns (Investor Presentation)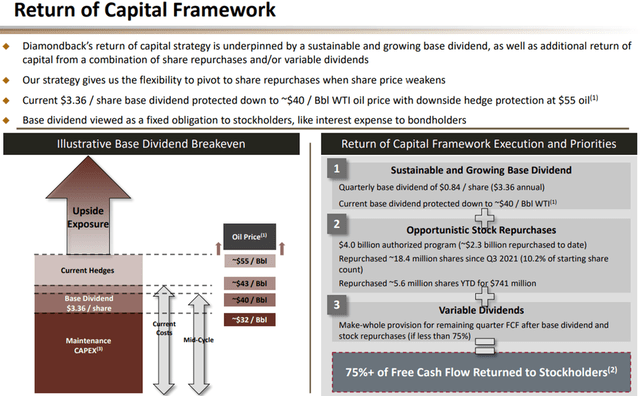
Dollars
So far, FANG is knocking it out of the park. The ultimate goal for shareholders is to optimize FCF per share as this will determine the payout to shareholders. We also want to pay as little as possible for that FCF with a low Price/FCF multiple.
I annualized Q3 production data to give a rough estimate of cash generation over a full year. This will obviously change with energy and share prices but the relative difference between the two companies is what is important. As shown below, both DVN and FANG trade at essentially the same Price to FCF ratio.
This would indicate that both companies are valued nearly the same. However, the direction of operating expenses for both companies are heading in opposite directions. FANG is projecting for slightly higher OPEX following the Deep Blue divesture, while DVN is projecting for lower OPEX by targeting higher quality wells. As a result, I have given the final point to DVN by a slight margin.
Summary
The “official” score has Diamondback Energy (FANG) for the win with a final score of 3-1. Here are the highlights of each discussion.
- The Delaware and Midland basins have contrasting qualities between cost and oil production. Diamondback is able to obtain a higher operating margin due to a higher percentage of oil production and lower operating costs. FANG was awarded the point for that reason.
- Both companies have nearly identical amounts of debt. Diamondback has a lower cost of debt with no maturities due over the next 2 years. This creates a very clear path for optimized shareholder returns over the medium term. FANG was awarded the point in this category.
- Diamondback has a 75% return model versus 70% for DVN. The combination of a higher percentage of returns, higher margins and lower debt costs will produce superior shareholder returns. FANG was awarded the point in this category.
- Both companies trade at equivalent price to FCF multiples. The point was awarded to DVN for decreasing operating expenses going forward while FANG’s are projected to slightly increase.
Overall, the differences in each category are small, making both companies viable investments. Given these results, FANG should prove to be the more lucrative investment based on the current performance. However, DVN is taking actions that may very well close the gap between the two companies by the end of 2024. In my opinion, these actions warrant holding DVN for a two quarter evaluation period prior to deciding to reallocate my DVN position.
For investors looking to initiate a position, FANG is a clear winner in this head-to-head. I rate both companies as a buy at current prices.
