tadamichi
In this brief market report, we look at the various asset classes, sectors, equity categories, exchange-traded funds (ETFs), and stocks that moved the market higher and the market segments that defied the trend by moving lower. Identifying the pockets of strength and weakness allows us to see the direction of significant money flows and their origin.
The S&P 500 sets a new record high
For the week just past, the S&P 500 was up 1.2%. Year-to-date it is up 1.5%. Over the past 30 days, it is up 2.6%. Over the past 12 months, it is up 23.2%. Since the bull market began in October 2022 it is up 35.3%.
Zen Investor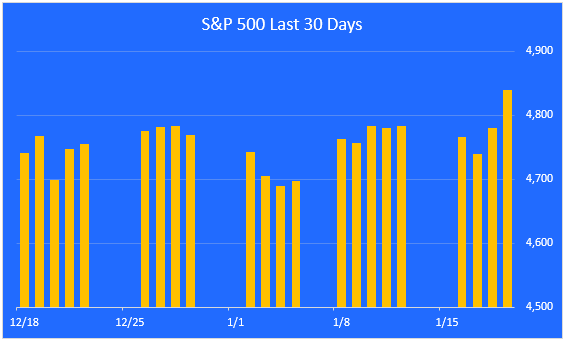
A look at monthly returns
This chart shows the monthly returns for the past year. After a correction from August through October, the market has been on a tear.
Zen Investor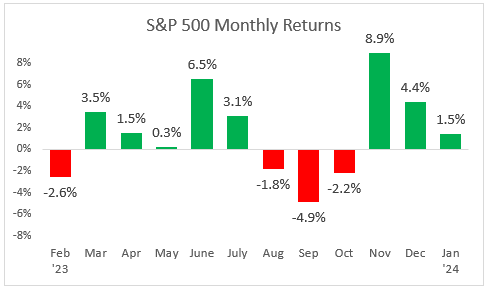
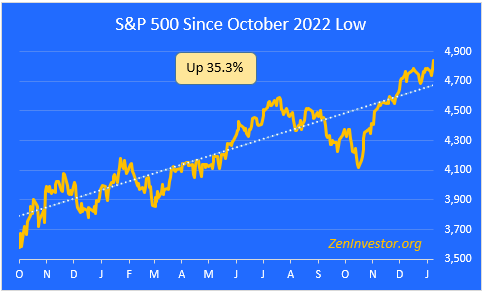
A look at the bull run since it began last October
This chart highlights the 35.3% gain in the S&P 500 from the October 2022 low through Friday’s close. We made good progress last week even though Q4 corporate earnings so far have been tepid.
Major asset class performance
Here is a look at the performance of the major asset classes, sorted by last week’s returns. I also included the year-to-date returns as well as the returns since the October 12, 2022, low for additional context.
The best performer last week was the NASDAQ index, powered by strength in the technology sector.
The worst-performing asset class last week was Blockchain. Not to be confused with Bitcoin and other cryptocurrencies, Blockchain tracks the performance of companies involved in the development and utilization of blockchain technologies. This includes companies engaged in research, development, and implementation of blockchain solutions across various sectors.
Zen Investor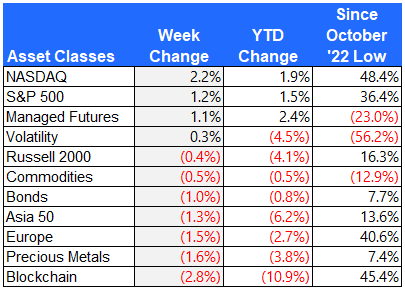
Equity sector performance
For this report, I use the expanded sectors as published by Zacks. They use 16 sectors rather than the standard 11. This gives us added granularity as we survey the winners and losers.
Technology had a very good week, especially among the Magnificent 7 mega-cap stocks. Software and semiconductor companies rallied sharply.
Utilities, energy, and real estate lagged behind as rates inched higher and oil showed weakness.
Zen Investor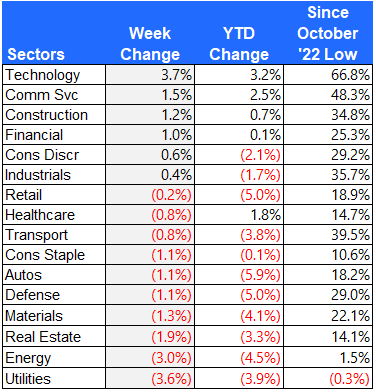
Equity group performance
For the groups, I separate the stocks in the S&P 1500 Composite Index by shared characteristics like growth, value, size, cyclical, defensive, and domestic vs. foreign.
The best-performing group last week was the Magnificent 7. Even though these 7 stocks continue to lead the market higher, market participation is broadening out, which is a healthy sign.
Emerging market stocks sold off last week, as did defensive stocks like utilities and consumer staples.
Zen Investor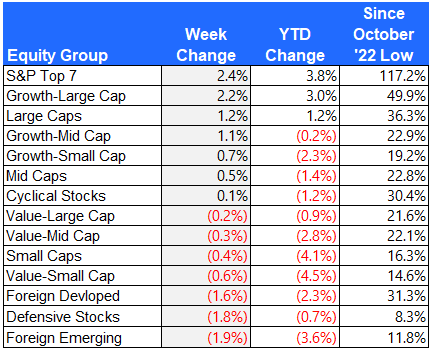
The S&P Top 7
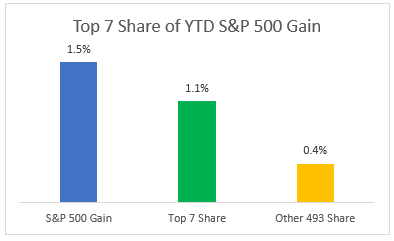
Here is a look at the seven mega-cap stocks that have been leading the market over the past year. These seven stocks account for 72% of the total YTD gain in the S&P 500. That’s down from 87% just a few weeks ago, providing evidence that participation in the bull market is broadening once again.
Zen Investor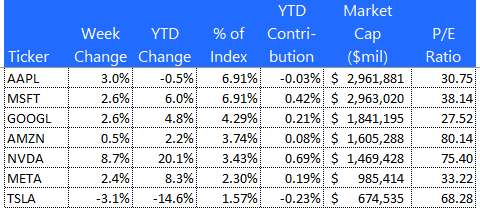
The 10 best-performing ETFs from last week
The VanEck Semiconductor ETF (SMH) took the top spot on the ETF leaderboard, gaining a whopping 8.2% in one week. Cannabis stocks are off to a good start this year.
Zen Investor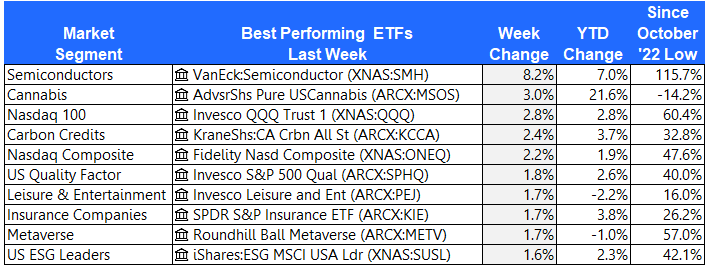
The 10 worst-performing ETFs from last week
Rare Earth Metals, Solar Energy, and China Equity are all struggling. Bitcoin sold off last week but is up sharply over the last 15 months.
Zen Investor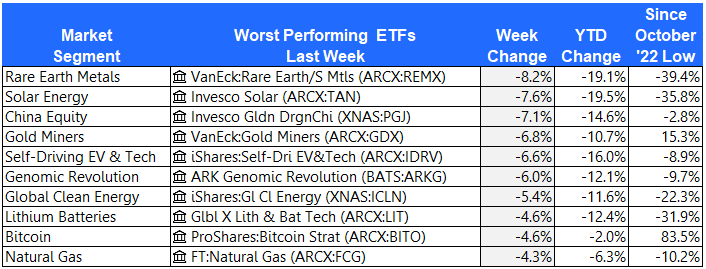
The 10 best-performing stocks from last week
Here are the 10 best-performing stocks in the S&P 1500 last week.
Private equity firm Arcline Investment Management announced it will buy Kaman Corp. (KAMN) for a huge premium.
Zen Investor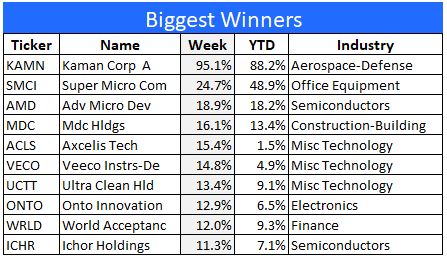
The 10 worst-performing stocks from last week
Here are the 10 worst-performing stocks in the S&P 1500 last week.
iRobot (IRBT) stock plummeted after the EU moved to block its takeover by Amazon (AMZN).
Zen Investor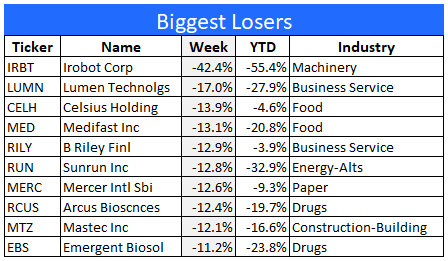
Final thoughts
The S&P Top 7 stocks continue to dominate the market, but that dominance is slipping lately. As the following chart shows, these seven mega-cap tech stocks still account for 72% of the S&P 500 YTD gain. In 2023 they accounted for 87% of the market’s gain.
After several weeks of narrowing market participation, it now looks like leadership and participation are beginning to broaden again. This can be seen in the performance of small and mid-cap stocks, which have recently been outperforming large caps.
The fact that the market as a whole went up last week, even though rates rose and earnings were tepid, tells me that this rally is not over yet. And as market participation broadens, the durability of this bull run is enhanced.
Editor’s Note: The summary bullets for this article were chosen by Seeking Alpha editors.


