cemagraphics
The S&P500 (SPY) has finally done it – a break to new all-time highs following the 2023 break-outs of the Nasdaq (QQQ) and Dow Jones (DJI). Furthermore, it did so against a backdrop of rising yields and falling odds of a March cut. But is this just a “fake-out” to squeeze out bears, or is the break genuine?
This article will look at what to expect now the S&P500 has broken all previous resistance, and will outline conditions for either a reversal or continuation. Various technical analysis techniques will be applied to multiple timeframes in a top-down process which also considers the major market drivers. The aim is to provide an actionable guide with directional bias, important levels, and expectations for future price action.
S&P 500 Monthly
With only eight sessions remaining in January, the bar is set high for a reversal to develop. A monthly close of 4745 or below is needed to form a bearish candle. It’s possible, but not very probable. More likely, January closes strong and any reversal will be delayed until February or later.
Now the S&P500 is in “blue sly” at new all-time highs, Fibonacci extensions and measured moves will act as a guide for targets.
SPX Monthly (Tradingview)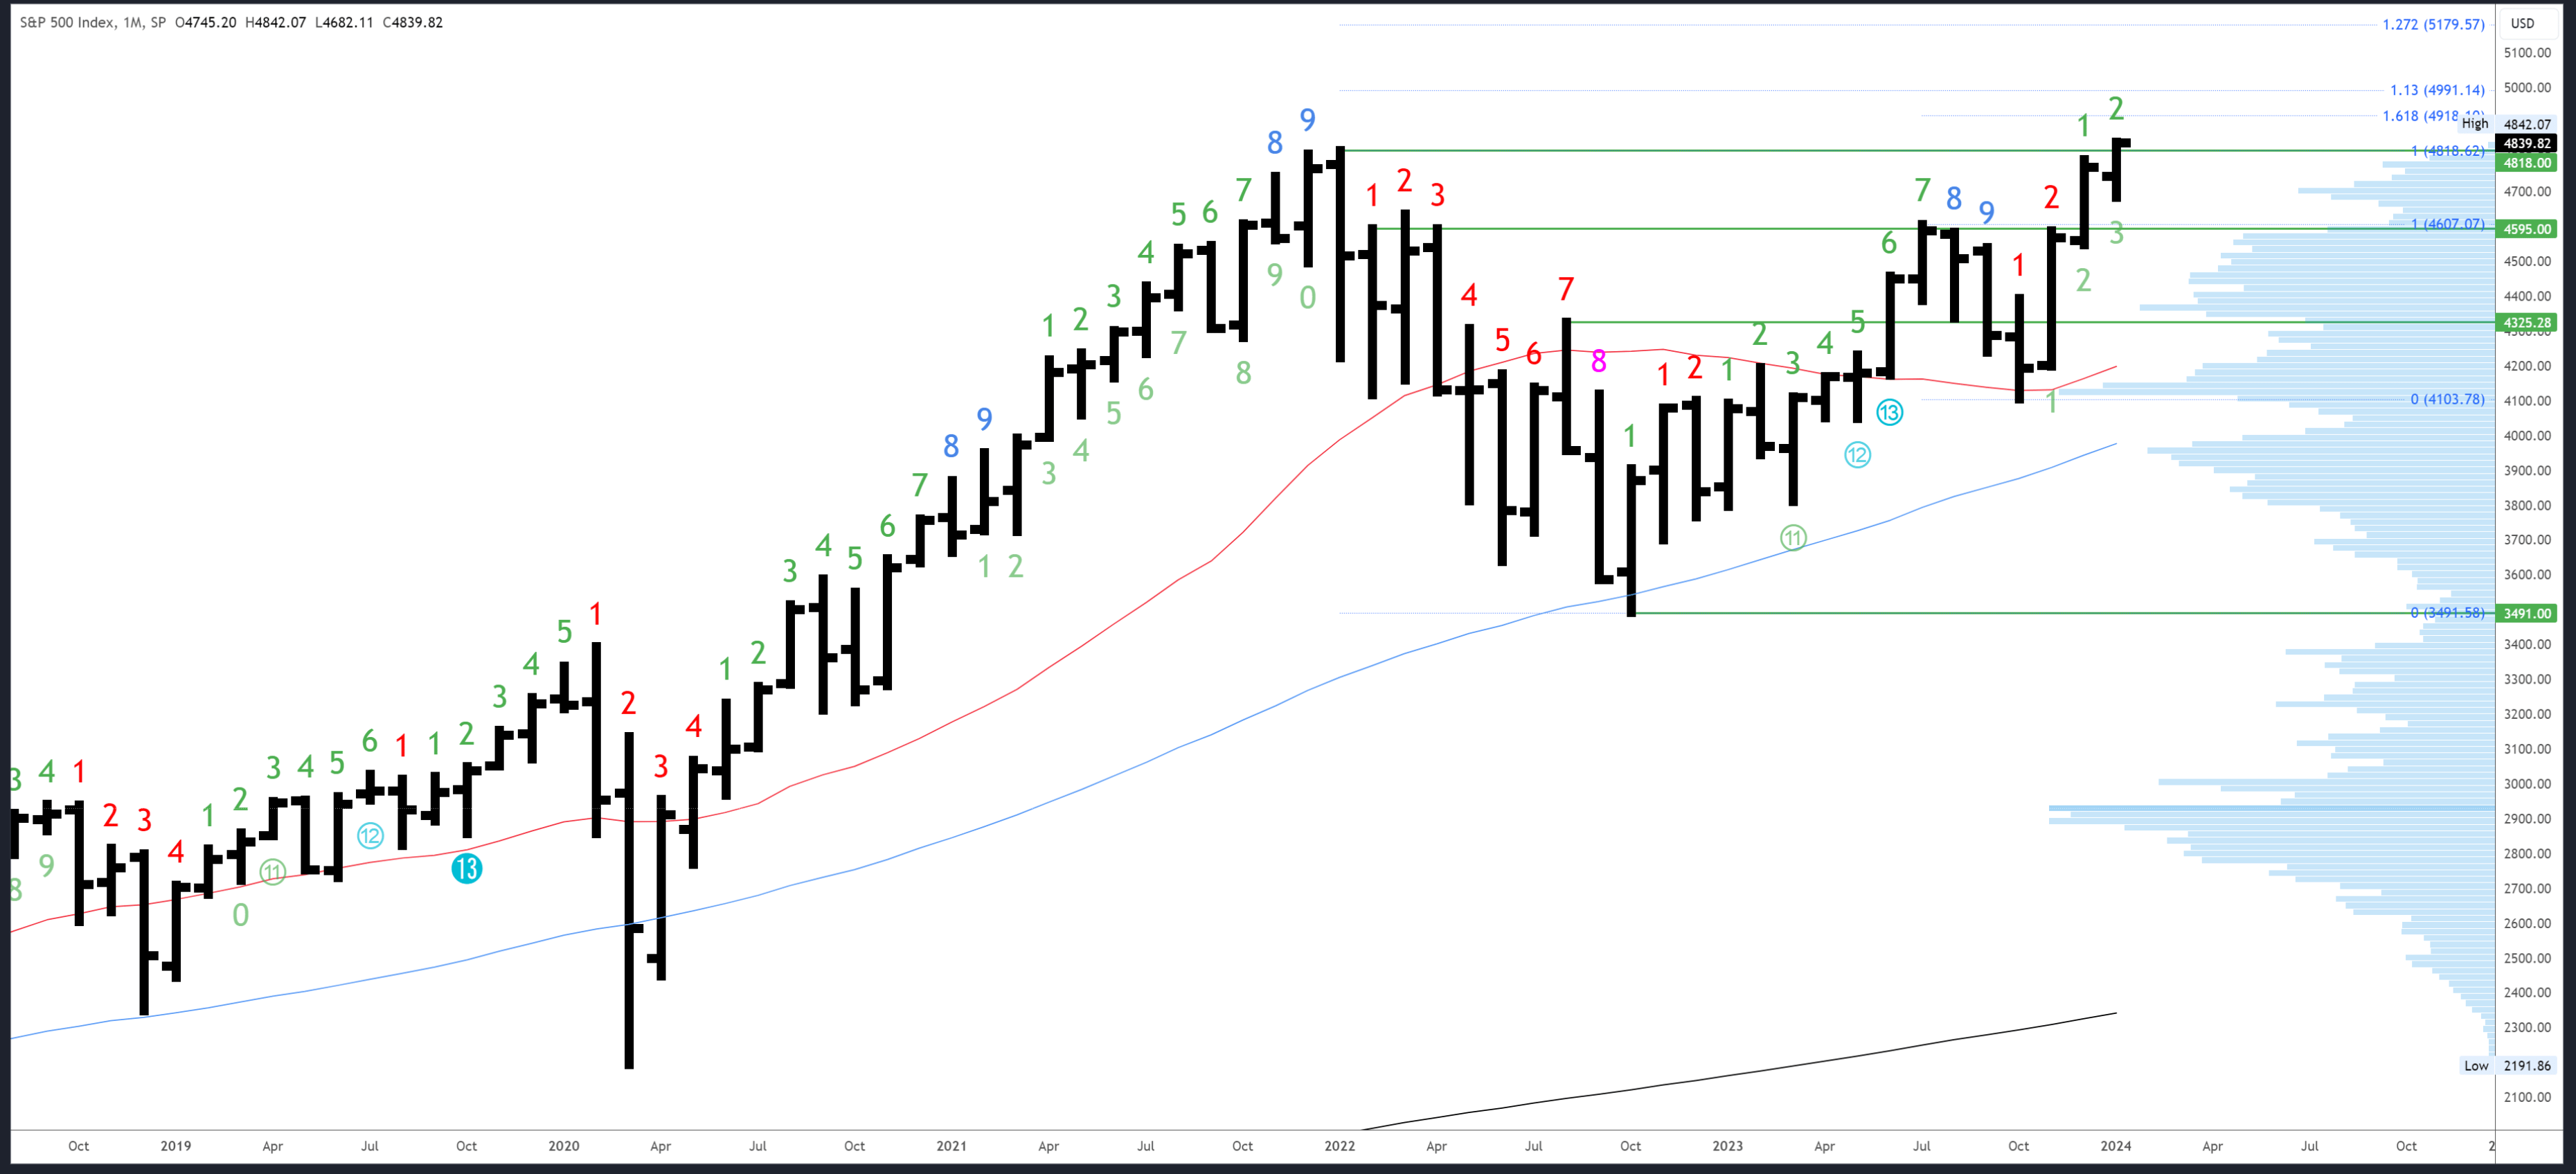
The first of Fib extension (the 1.618* extension of the July-October decline) comes in at 4918.
4818 is obviously an important level for the breakout, with the January open of 4745 also key.
There will be a long wait for the next monthly Demark signal. January is bar 2 (of a possible 9) in a new upside exhaustion count.
S&P 500 Weekly
A strong weekly bar formed this week with another higher low, higher high and another highest close ever. Continuation looks likely.
A reversal can develop with a failure at a further high and drop below 4818 into weak close, but there is nothing to suggest this will happen, yet.
As mentioned last week, when a market trades back to a significant top after a long decline, there is often a sequence of failed dips, failed rallies and “messy” short-term action. Bears get excited when price turns down (a double top!) and bulls get excited when price turns up (a breakout!). This sequence may have already played out over the last month or so, but there is still a risk of a “rug pull”.
If the S&P500 does make a surprising reversal early next week, it is likely part of this process and a dip under 4818 can still recover for new highs.
SPX Weekly (Tradingview)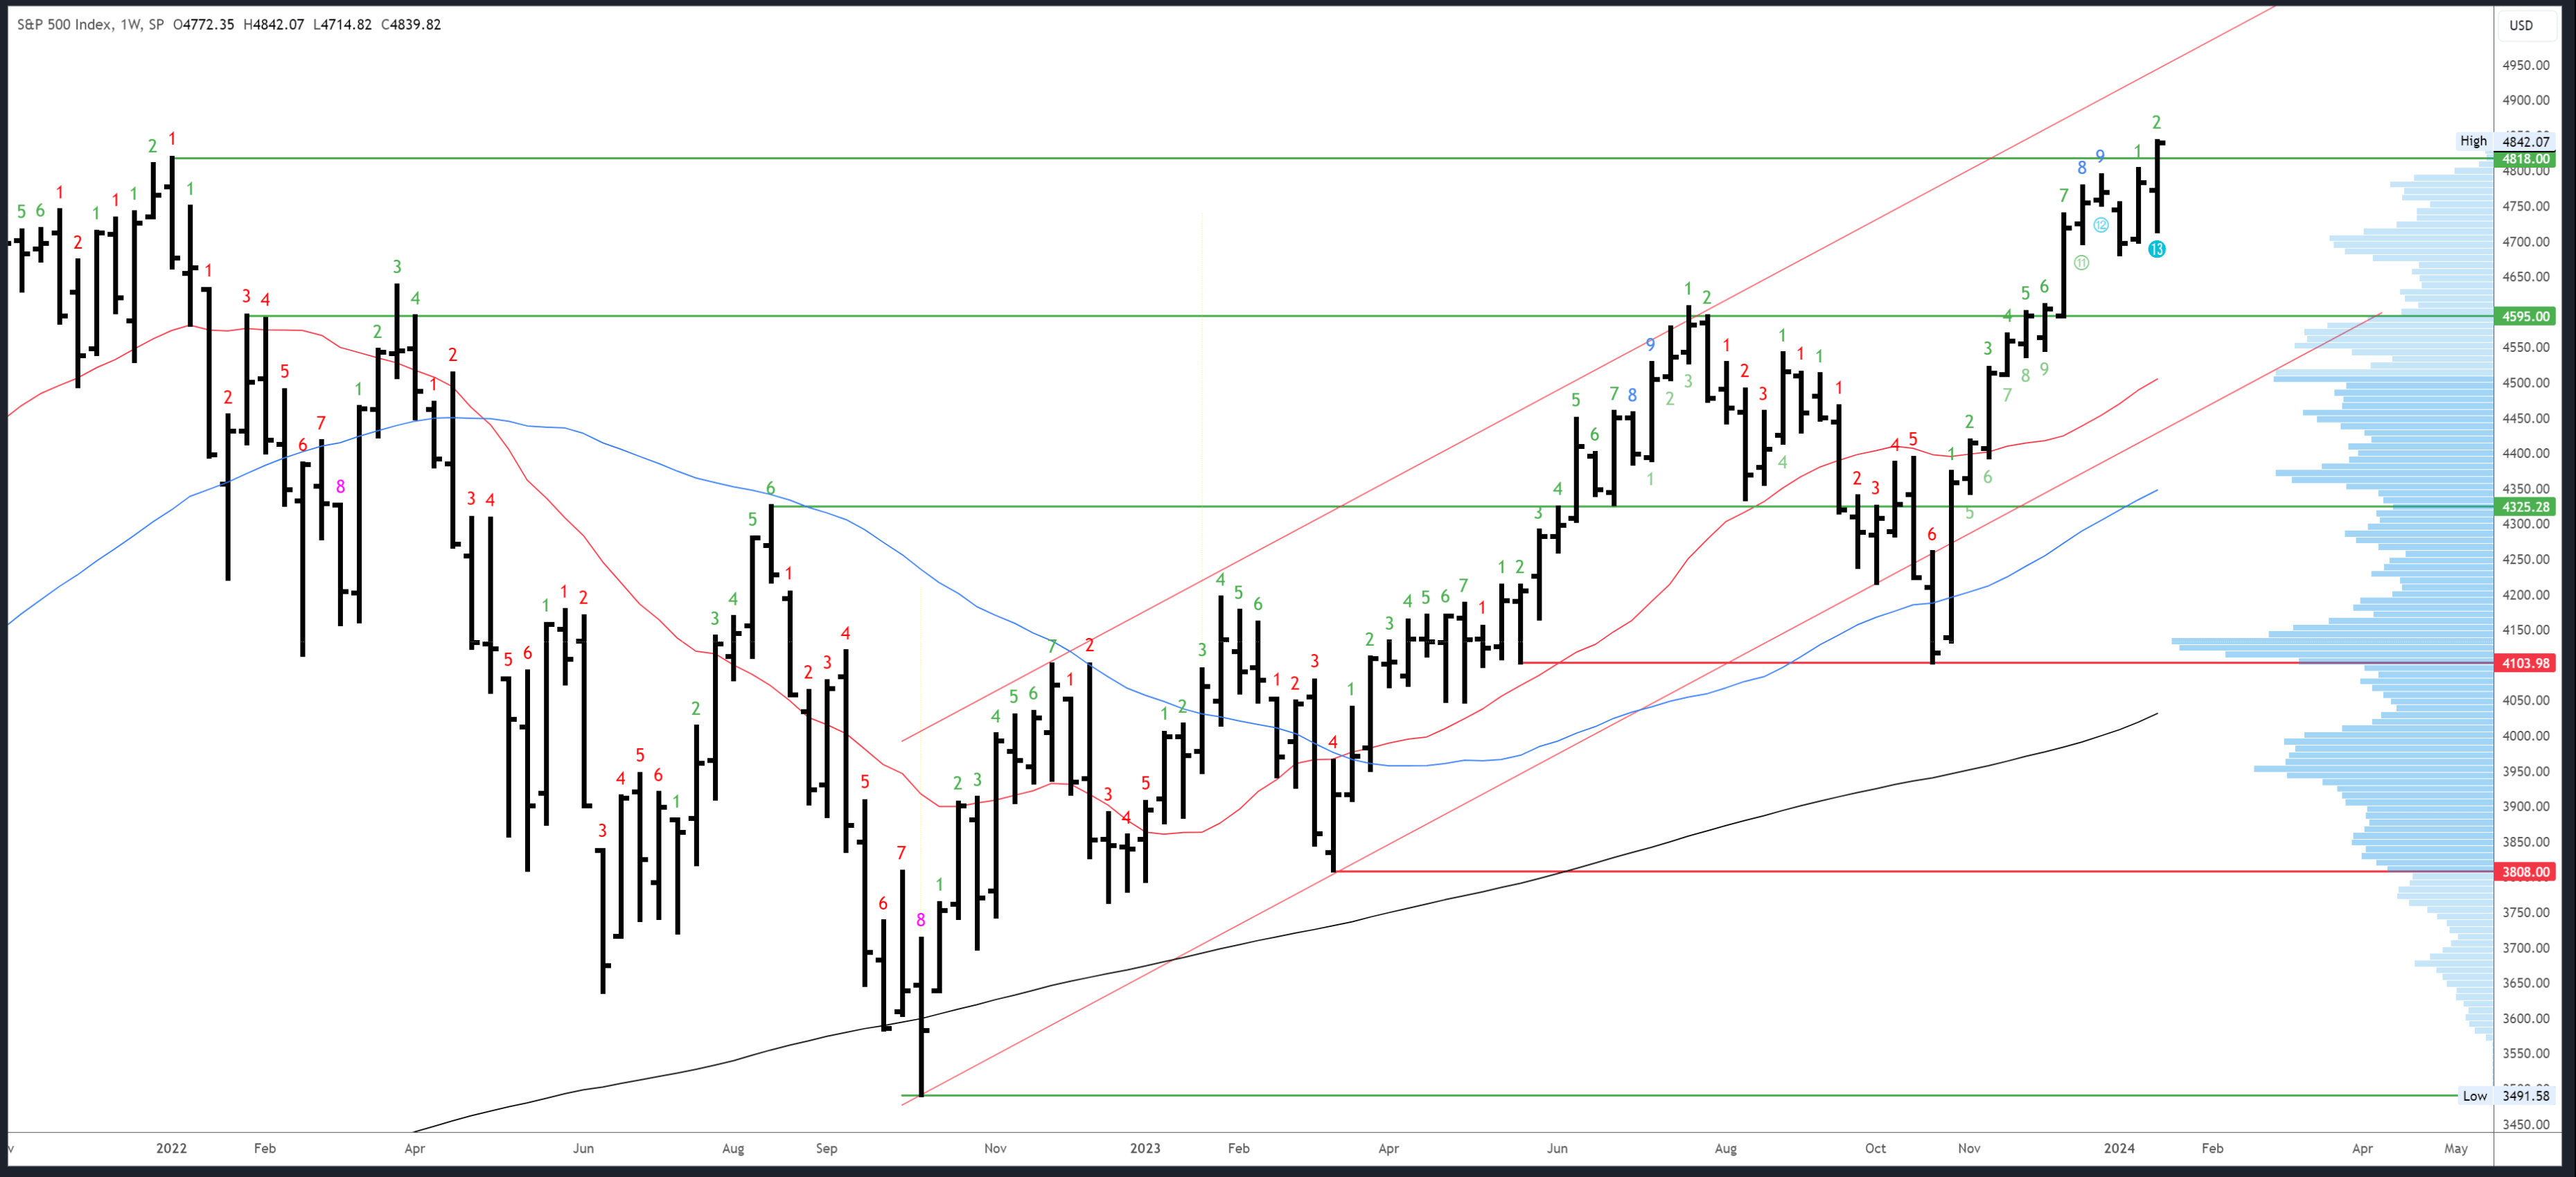
Weekly targets are the same as the monthly targets. There is channel resistance around 4950 but this is too distant to be relevant next week.
Potential support is 4802-4818, with this week’s low of 4714 the next level.
An upside Demark exhaustion count will be on bar 3 (of 9) next week. Also worth mentioning is that another Demark signal – a 9-13 – completed this week and could have an effect.
S&P 500 Daily
The daily chart shows Wednesday’s reversal, Thursday’s strong session and Friday’s big break-out. Volume was highest on Friday which is a positive for the breakout. It also came after a month of bullish consolidation and the daily Demark exhaustion count is only on bar 2 i.e. it is not close to an exhaustion signal. With the strong close right at the highs of the session/week, there are no red flags for this breakout.
SPX Daily (Tradingview)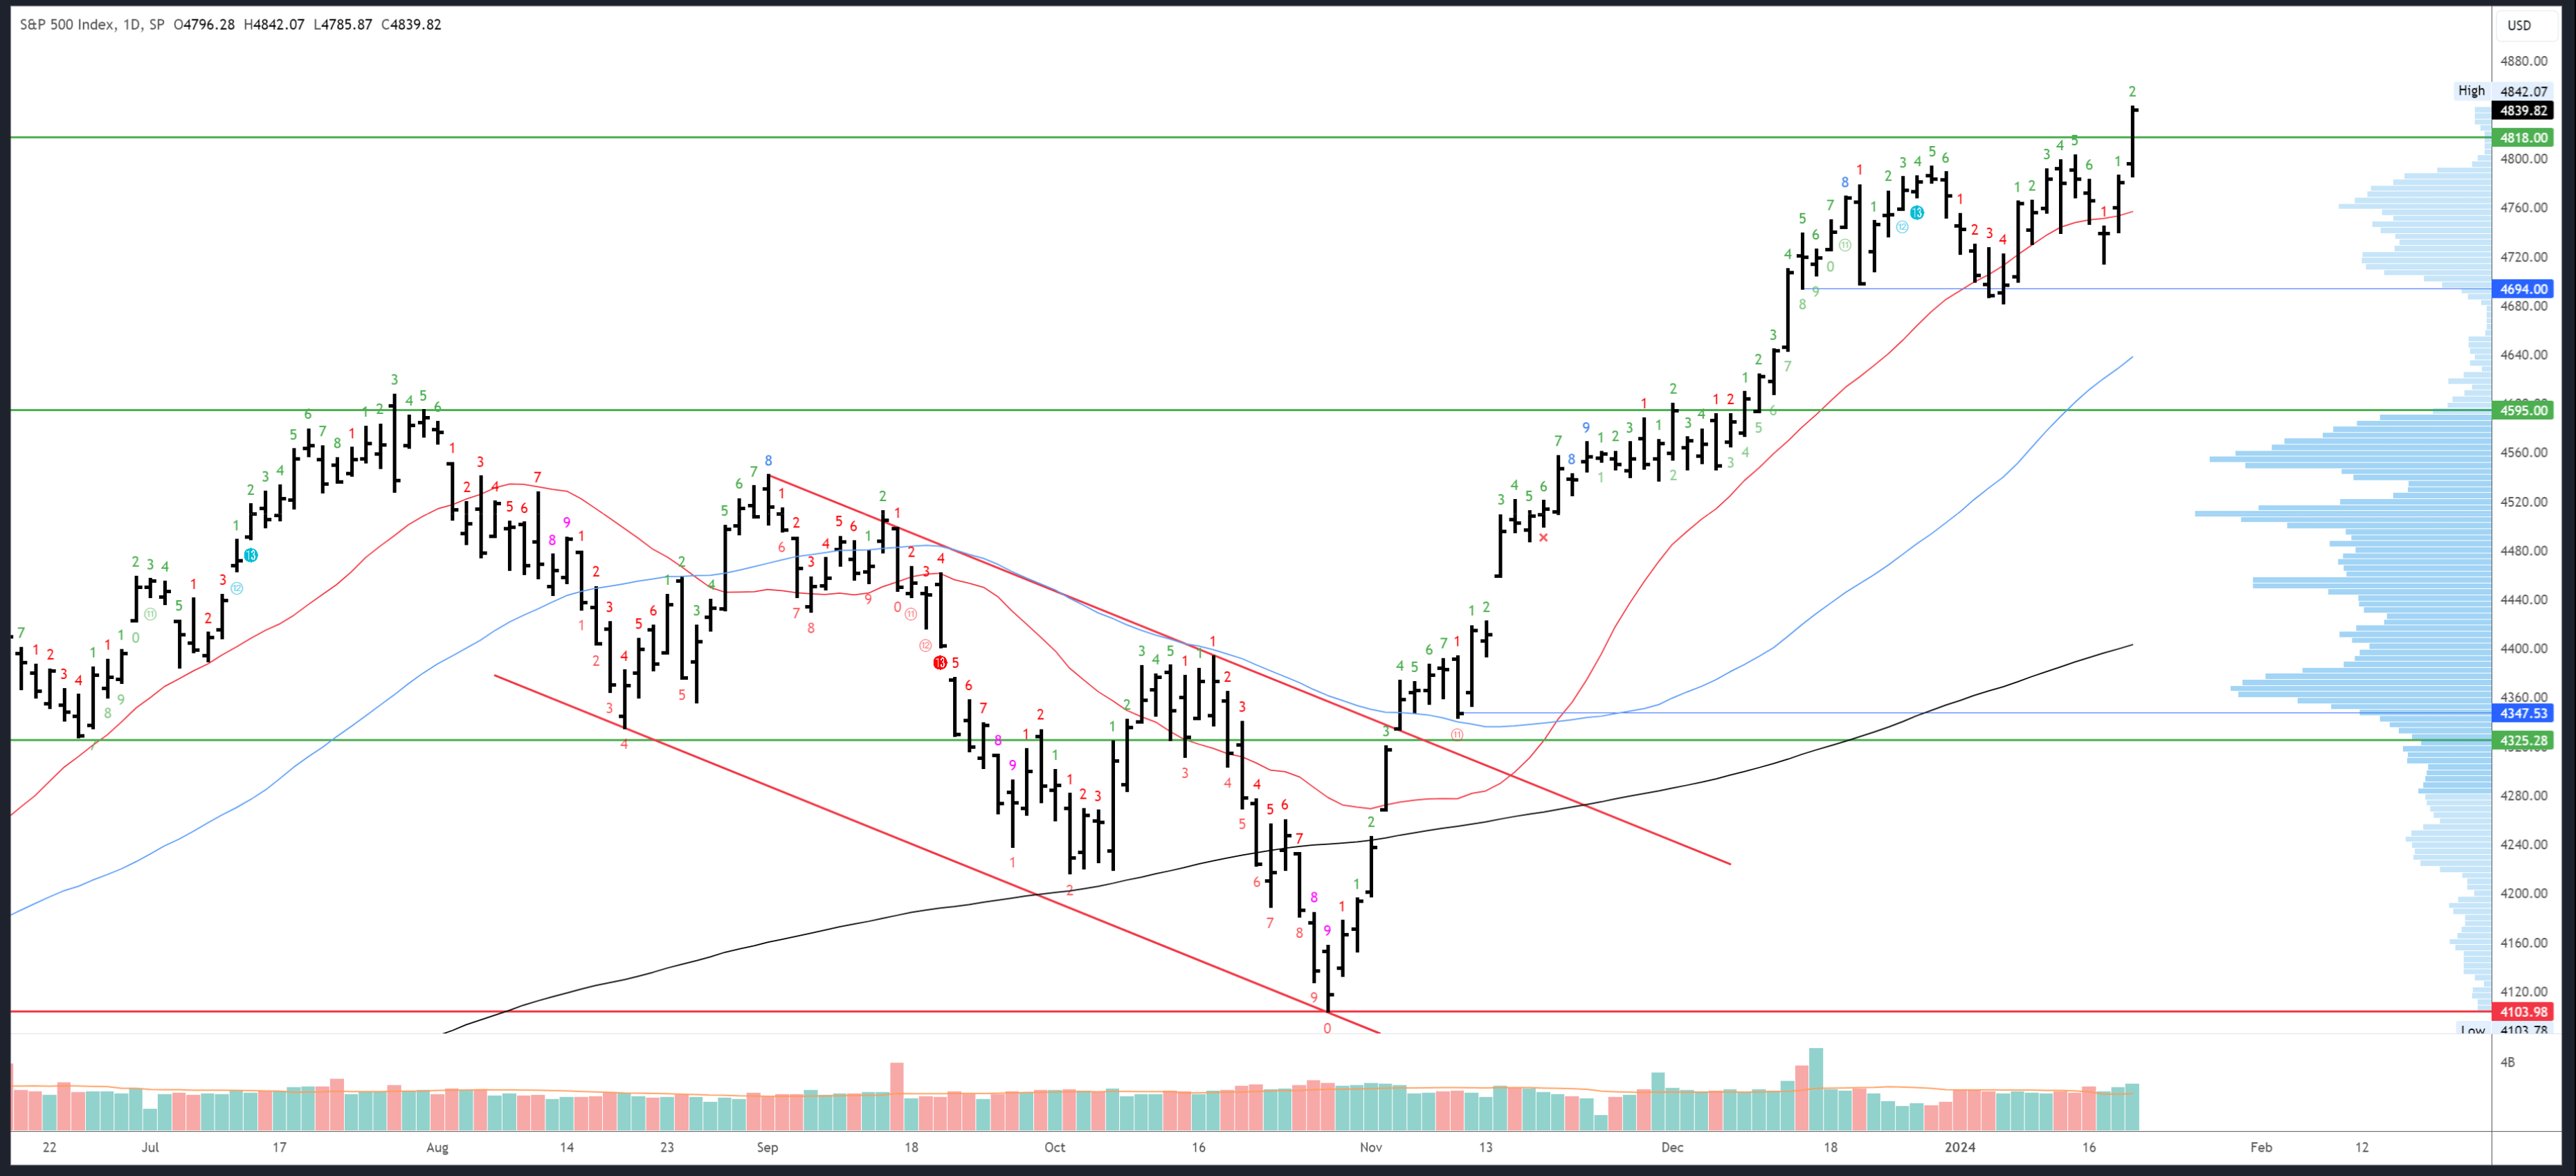
4918 is the first target, and there is a measured move (possible wave 5=wave 1) at 4967.
Friday’s low of 4785 is important support. If price trades below, all Friday’s breakout traders will be underwater.
An upside Demark exhaustion count will be on bar 3 (or a possible 9) on Monday which means no signal or reaction is expected next week.
Drivers/Events
The market finally listened to the Fed and the data and eased off dovish bets; the odds of a March hike are now near 50/50, which seems about right given there are still two NFP and two CPI releases to come before the March FOMC meeting. i.e. anything can happen.
Bonds have fallen around 7% from the December high as dovish bets have been unwound, but the S&P500 closed the week at new all-time highs. This has probably confused a lot of traders but the technicals suggested stocks were bullish despite the backdrop. As I concluded last weekend, “Given the strong trend and bullish reaction to CPI, there are better odds for continuation higher.”
Next week’s data will give a snapshot of the economy with PMIs on Wednesday and advance GDP on Thursday. Recent data has been impressive, with Retail Sales beating estimates and Unemployment Claims of just 187k. It seems the S&P500 is more focused on the strong economy rather than when the Fed starts its cutting cycle. At least for now.
Friday’s release of the Core PCE Price Index will be worth watching, but I suspect data will be largely overlooked until the 13th February when the January CPI figure is released alongside the annual 2023 benchmark inflation revisions.
Earnings season heats up next week with more than 70 S&P500 companies due to report.
Probable Moves Next Week(s)
The breakout above 4818 looks genuine and there are no red flags, yet. Indeed, the rally looks set to continue into a strong January close and the beginning of February, with 4918 and 4967 potential upside targets.
As with any major break-out, euphoria and complacency could be an issue and lead to a surprise “rug pull.” This can’t always be predicted, but it can be prepared for. A sharp drop could spike through 4818 but should hold Friday’s 4785 low.
The weekly close will be important again. Closing below 4818 and near the lows of the weekly range would be a surprise bearish development. Another strong weekly close near the highs would project continuation.

 Q2 2024 Earnings Call Transcript")

