Anton Petrus/Moment via Getty Images
Letter Summary
2023 was anomalous in the degree to which gains were concentrated among a select few stocks in the large-cap space. Figure 1 compares the annual performance of an equal-weighted index of large stocks to a capitalization-weighted one and shows that 2023 was the second worst year for the equal weight index going back to 1930! Yet while the market’s overall valuation became more stretched as some of the largest companies meaningfully outperformed, we continue to find attractive situations such that our U.S. Fundamental Stability and Value (U.S. FSV) strategy’s free cash yield of 6.9% is well above the comparable 4.5% for the S&P 500 ETF (SPY), while still emphasizing quality. We are also finding highly attractive opportunities among international and smaller U.S. stocks, where our process avoids the debt and profitability issues that we believe are hampering performance of the broader benchmarks and adding considerable risk. Beneath the surface of the broader indexes that look expensive or risky in other ways, we are still finding attractive investments by following the advice of the late great Charlie Munger to “fish where the fish are” and avoiding the over-fished spots.
Performance Summary
U.S. Fundamental Stability & Value (NYSEARCA:DSTL, U.S. FSV): The concentrated gains in the large cap space created a headwind to performance for our large-cap U.S. FSV strategy (U.S. FSV), where a total return net of fees of 22.7% lagged the S&P 500’s (SP500, SPX) 26.3% total return by 3.6% in 2023. The strategy outperformed the Russell 1000 Value ETF’s total return of 11.3% by 11.4%. Annualized net of fee performance since inception is 2.2% ahead of the S&P 500 and 6.9% ahead of the Russell 1000 Value ETF.
U.S. Small/Mid Cap Quality & Value (DSMC, SMID QV): The 29.5% net of fee total return for our SMID QV strategy bested the Russell 2000 ETF benchmark by 12.6% and the Russell 2000 Value ETF benchmark by 15.0% in 2023, and annualized excess returns since inception and net of fees are 9.7% and 9.2% ahead of those benchmarks.
International Fundamental Stability & Value (DSTX, Intl. FSV): Our International FSV strategy returned 20.1% net of fees in 2023, 4.6% ahead of the MSCI All Country Ex U.S. ETF benchmark. Annualized net of fee performance since inception is ahead of the benchmark by 0.9%.
U.S. Large Cap Value Long 130%/Short 30% (U.S. Value 130/30): Our 130/30 strategy, which by design produces more variable performance, returned 12.1% net of fees through in 2023 and trailed S&P 500 Index by 14.2%. It remains 5.7% ahead of the S&P 500 ETF on an annualized net of fee basis and above the Russell 1000 Value ETF by 10.6% since inception.
Additional performance analysis and rebalance data for all strategies can be found in the Performance Appendix of this letter.
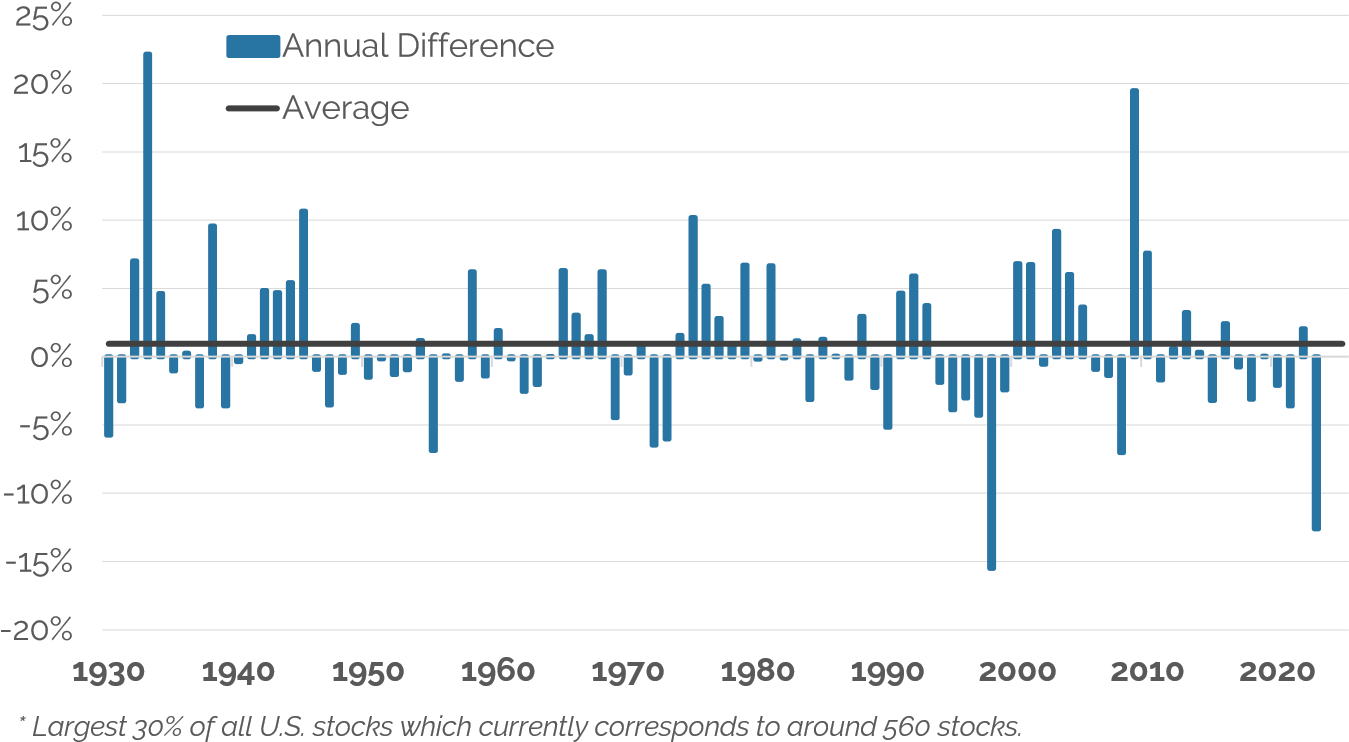
Figure 1: Annual Return of Equal-Weighted Index Less Market Cap-Weighted Index
|
Source: Ken French Data Library, 2023 uses equal weight S&P 500 ETF (RSP) vs. S&P 500 ETF (SPY) Past performance does not guarantee future results. One cannot invest directly in an index. |
Market Commentary
Despite expectations for a recession and pessimism on the outlook for equities coming into 2023, economic growth remained positive as inflation moderated and the S&P 500 Index rose sharply. The consensus weighted average next-twelve-month (NTM) free cash flow per share estimate for the S&P 500 continued on the downward trajectory of 2022 into the start of the year but bottomed in May and ended the year 9.2% higher. (See Figure 2).
Figure 2: S&P 500 Free Cash Flow vs. Price
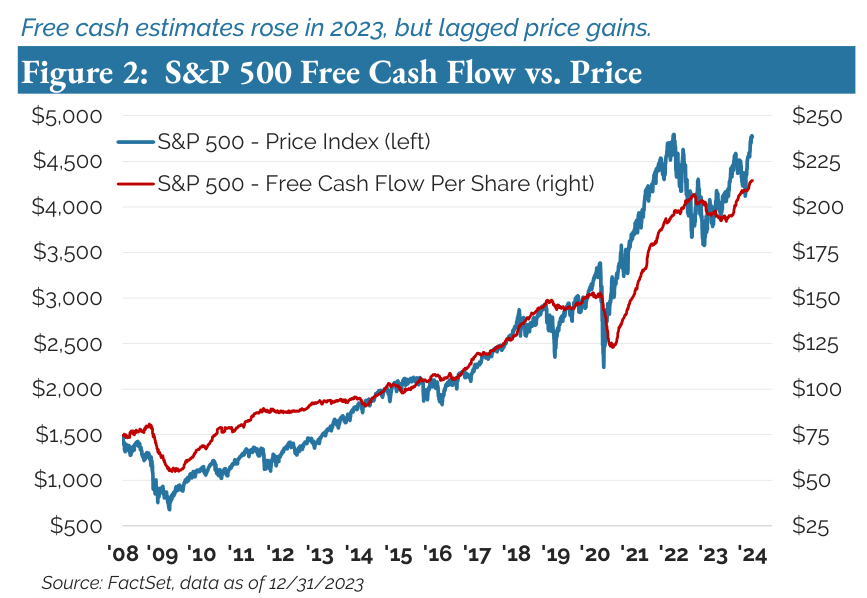
This rise in estimated free cash flows, though positive, considerably trailed the S&P 500’s price rise such that its free cash flow yield fell from 5.1% at the start of the year to 4.5% at year end. Much of this deterioration in valuation, however, relates to the same concentration issue highlighted in Figure 1 on the previous page. Apple (AAPL) and Microsoft (MSFT) are the biggest two stocks in the S&P 500 Index with staggeringly large weights of nearly 7% each. The market value of each stock soared by approximately one trillion dollars in 2023 while their free cash flows (and sales in the case of Apple) were stagnant (See Figure 3). Valuations became significantly richer as a result, with Apple now trading with a 3.6% free cash flow yield and Microsoft under 2.6%, a valuation where Microsoft would need to fall by over 40% to be valued in-line with the overall market.
Figure 3: Microsoft & Apple 2023 Change in Valuation vs. Estimated Free Cash Flows & Sales
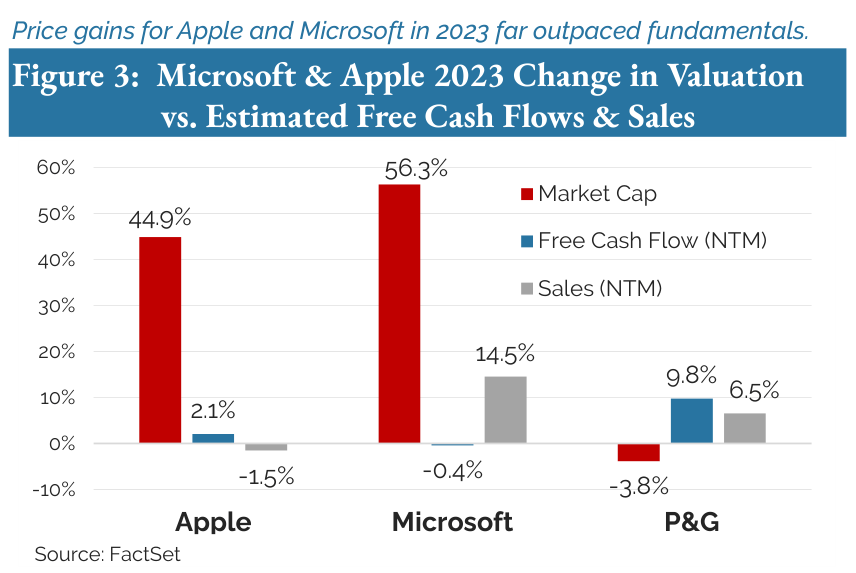
Figure 3 contrasts Apple and Microsoft with Procter & Gamble (PG), which became more attractively valued over the year as its estimated free cash rose while its market value fell. Consequently, P&G was one our largest purchases in the most recent rebalancing. We believe this highlights two key points. First, there is significant risk in having almost 15% of a portfolio in two richly valued stocks with high growth expectations and anemic free cash flow gains over the past year, as many people do through passive exposure to the capitalization weighted S&P 500 Index. Second, we believe it is important to be able to take advantage of situations like P&G when sentiment and market fluctuations provide opportunities in highly desirable businesses.
Microsoft and Apple are two of the often mentioned “Magnificent 7” that are responsible for a significant portion of the market’s rise in 2023. But not all seven are the same. While Microsoft and Apple each added around one trillion in market value purely on the basis of multiple expansion, Amazon (AMZN) and NVIDIA (NVDA) shares were driven by significant increases in free cash flow expectations, such that their multiples actually declined. At year-end, NVIDIA’s free cash flow yield of 3.5% makes it considerably less expensive than Microsoft, though still much richer than the overall market. Tesla (TSLA), by contrast, is priced with a free cash flow yield of less than 1%. Its market value doubled in 2023 even as estimated free cash flows fell by half and rolling estimates for next-twelve-month sales were flat.
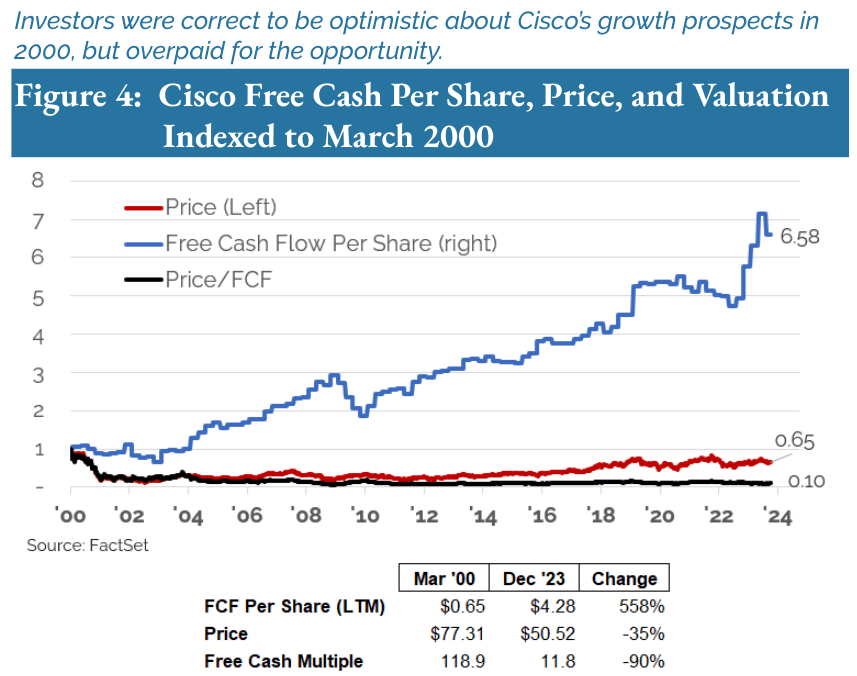
Our exposure to the group of seven that have taken so much of Wall Street’s attention remains solely in Alphabet (GOOG,GOOGL) which continues to look attractively valued, though less so than it did previously and thus our position size has been reduced. As for the others, our process emphasizes valuation to avoid situations where sentiment pushes a stock to a place where the risk/reward may be unfavorable despite (and often because of) a compelling growth story. As we have noted before, investors paying over 118x free cash flow for Cisco in 2000 were correct in expecting substantial free cash flow growth over the next quarter century, but the stock is still 35% below where it was then because of the 90% compression in its valuation (See Figure 4).
Figure 4: Cisco Free Cash Per Share, Price, and Valuation Indexed to March 2000
When we launched our strategy in 2017, Apple and Microsoft were our largest positions. They were among the absolute cheapest stocks in the marketplace and both are incredibly durable businesses. At present, both stocks look to be embedding substantial growth into their prices based on their valuations. As a result, there is potential significant risk of valuation compression should this growth disappoint. If valuations improve, or if any of the other mega-caps become attractively valued enough to fit our criteria, we will own them. But for now, aside from Alphabet, we are seeing considerably more opportunity elsewhere.
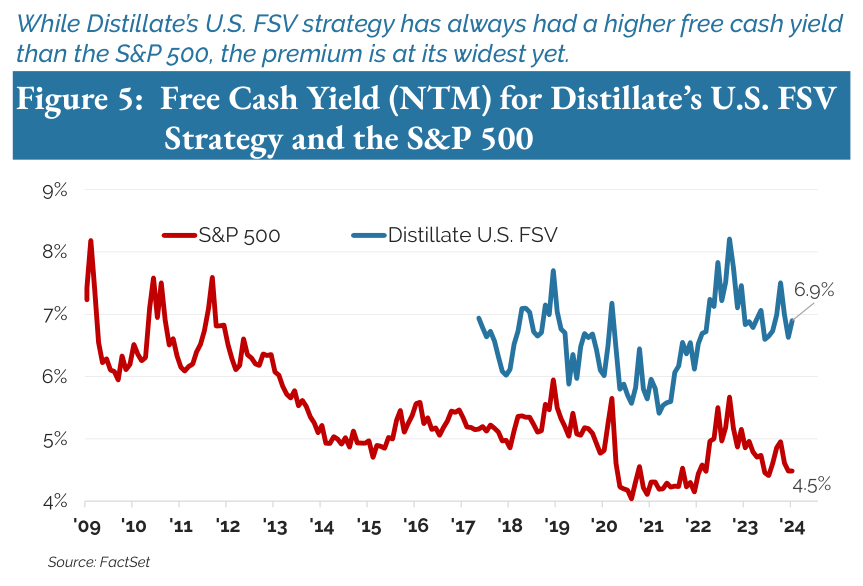
By focusing on the parts of the market that are not rich and taking advantage of the valuation dispersion at present, our U.S. FSV strategy is able to achieve a 6.9% free cash flow yield, which is the largest premium to the S&P 500 yield since it launched (See Figure 5.) Notably, our strategy does this while also investing in a portfolio of stocks that have low levels of debt and considerably more stable cash generation profiles than the broader market.
Figure 5: Free Cash Yield (NTM) for Distillate’s U.S. FSV Strategy and the S&P 500
Because our strategy achieves this free cash yield premium to the S&P 500 by avoiding some of the richly valued mega-cap stocks, our strategy has tended to look a bit more like the equal-weighted S&P 500 than the more standard capitalization-weighted version. There are several elements of this that we believe are worth discussing.
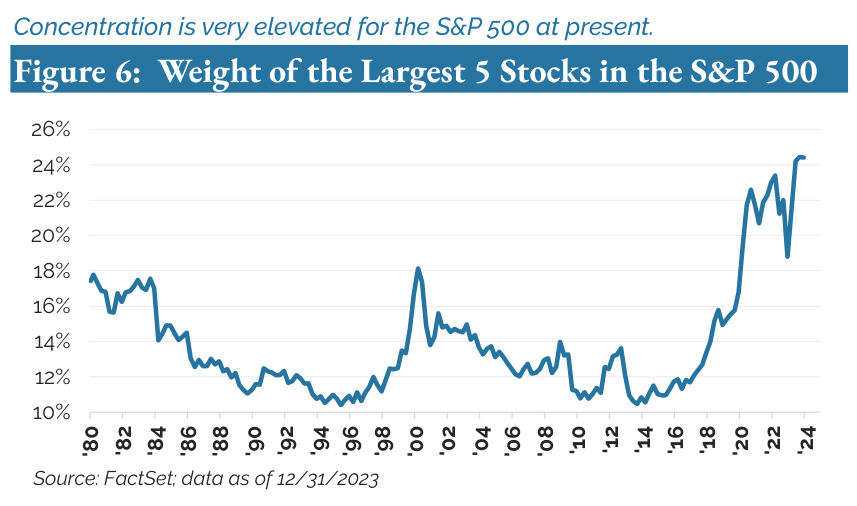
At present, there is an extremely high level of concentration in the market (see Figure 6) which inherently brings more risk to the cap-weighted benchmark. As a point of comparison, the combined weight of the largest five positions in our U.S. FSV strategy is 11%. There is thus much less risk of any single stock having an outsized negative impact on our portfolio than for the broader capitalization-weighted market.
Figure 6: Weight of the Largest 5 Stocks in the S&P 500
Second and worth noting, an equal-weighted version of a benchmark tends to outperform a capitalization-weighted version over the longer-term. In Figure 1, while the equal-weighted index of large U.S. stocks underperformed considerably in 2023, it has outperformed by 0.9% on average going back to 1930. It does so because of our dynamic and entrepreneurial economy where the largest stocks tend not to remain the largest stocks, being displaced by newer companies over time. Despite the seeming benefits of incumbency and size, the largest companies tend to succumb to forces like creative destruction, active inertia, and the innovator’s dilemma that are well documented and expounded upon in economic theory and corporate strategy (Shumpeter, Sull, Christensen). For example, IBM’s enormous research budget in the 1970s and 80s or Walmart’s (WMT) supply chain and ability so squeeze suppliers in the 1990s and early 2000s did not prevent either from falling out of the ranks of the top ten currently. Consistent with this turnover in leadership is the fact that many of the current largest stocks in the S&P 500 were only added to it in the last 20 years (Amazon 2005, Alphabet 2006, NVIDIA 2011, Meta 2013, Tesla 2020). And the same will likely be true of the next group of largest stocks two decades from now.
Last, cap-weighted indexes by design place more weight in stocks with higher valuations and less weight in shares that are potentially less expensive. This also works against the performance of capitalization weighted indexes relative to equal-weighted ones. While cap-weighted benchmarks were a vast improvement over price-weighted benchmarks when their use began in the 1920’s, they are hardly optimal for long-term investors, despite their general use.
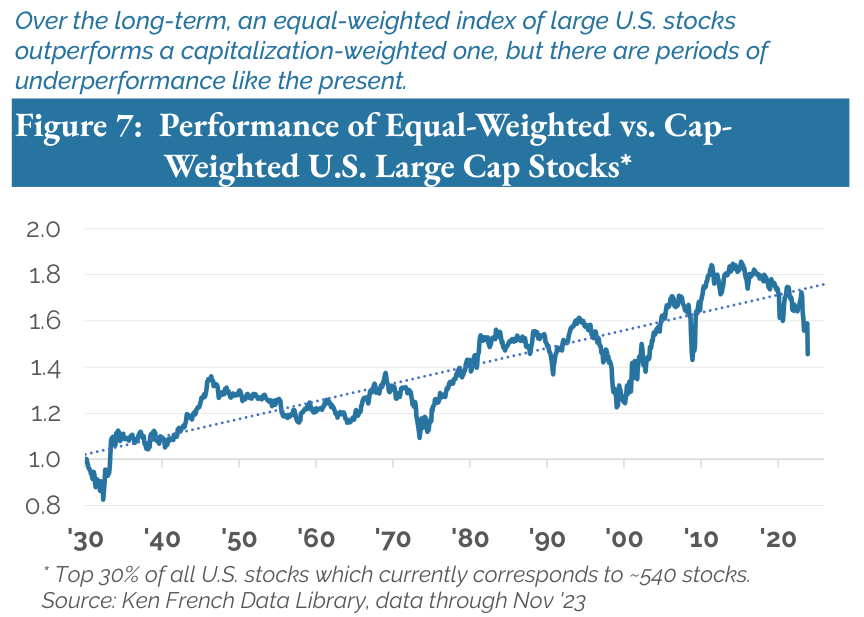
Figure 7 depicts the relative performance of the equal-weighted vs. cap-weighted index of the largest U.S. stocks over time. While the considerable outperformance of the equal-weighted index is clear, it highlights the extent and severity of the recent underperformance as the market became so highly concentrated. It also demonstrates that there have been other episodes of underperformance, and while it is desirable to resemble the equal-weighted index over time, it would be preferable to mitigate some of the drawdowns.
Figure 7: Performance of Equal-Weighted vs. CapWeighted U.S. Large Cap Stocks*
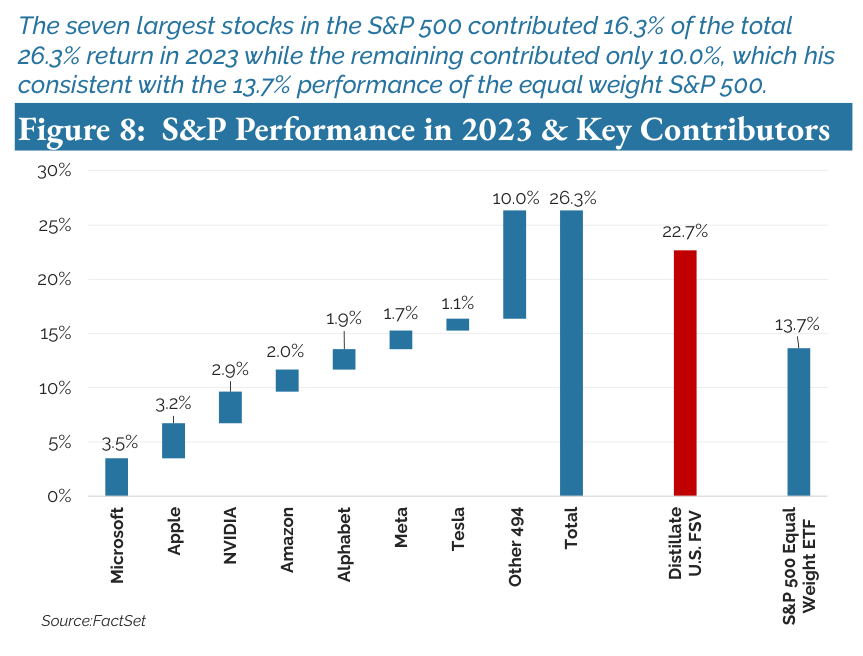
In 2023, our U.S. FSV portfolio was able to do exactly that and moderated some of the headwind from the near-record negative relative performance of the equal weight index. Figure 8 shows how the largest seven stocks contributed 16.3% of the S&P 500’s total return with the remaining 493 adding just 10%. We also highlight our U.S. FSV’s 22.7% return and that of the equal weighted S&P 500 ETF. Despite the disappointment of underperforming the capitalization-weighted S&P 500 in 2023, we were pleased to considerably outperform the equal-weighted index, taking advantage of the valuation opportunities hidden below the surface of the headline numbers.
Figure 8: S&P Performance in 2023 & Key Contributors
We avoid predictions and ultimately have little idea when the equal-weighted S&P 500 might resume its historical outperformance of the capitalization-weighted benchmark, but history, current valuations, economic theory and corporate strategy relating to the challenges of incumbency and size all suggest that in time it will.
Figure 9: Free Cash to EV Yield (NTM) for Distillate’s INTL FSV Strategy, ACWI Ex US and S&P 500
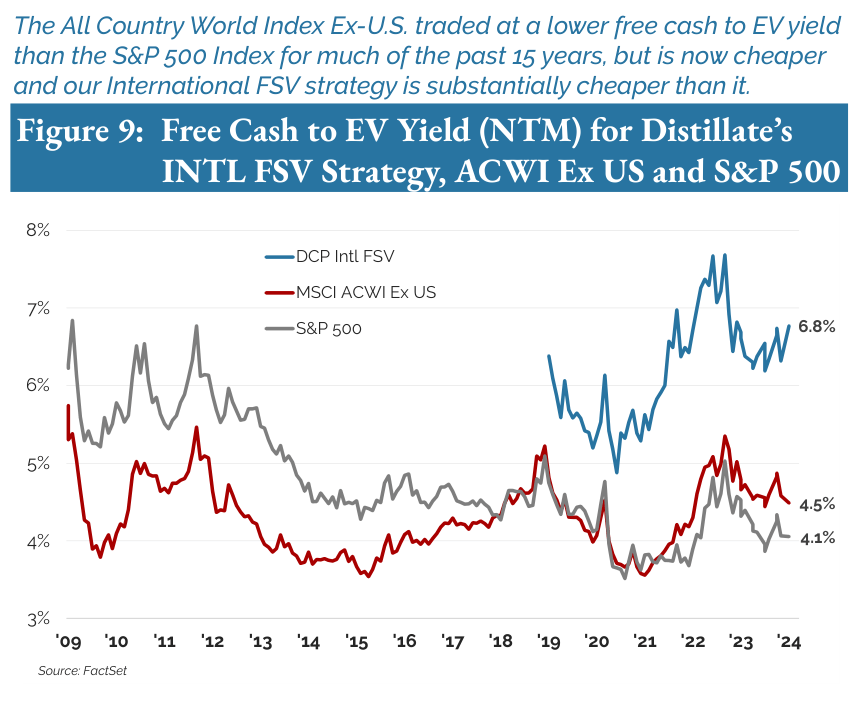
Internationally, we are finding attractive investment opportunities, but again believe that selectivity is essential to navigating risks in the benchmark. On the basis of next-twelvemonth consensus-estimated free cash flows to enterprise value, the international All Country World Index Ex-U.S. (ACWI Ex U.S.) is finally cheaper than the S&P 500 after the reverse was the case for much of the past 15 years (See Figure 9). Price-to-earnings-based valuations signaled that international stocks were cheaper 15 years ago, but as we have discussed extensively, such metrics suffer from significant distortions and we do not believe give an accurate indication of value. Free cash flows compared to market prices, by contrast in our estimation, provide a much more accurate and consistent view of the opportunities available to investors. But while the international benchmark is at long last cheaper than its U.S. counterpart, it does still suffer from having more leverage and a significantly less stable profile of cash flow generation. As well, the ACWI Ex U.S. benchmark also has a very large weight in banks, a sector with significant leverage and the additional risk that many banks are run secondarily in the interest of shareholders, often instead behaving first as arms of their governments, a risk we are happy to avoid.
While we see the international opportunity set as increasingly compelling as the headline valuation indicates, we believe it needs to be accessed selectively. Our International Fundamental Stability and Value (Intl. FSV) strategy assesses quality by utilizing our same examination of fundamental stability and leverage that is used in our domestic FSV portfolio. We begin there, but believe that paying less also provides downside protection. Consistent with that, the current International FSV portfolio provides a free cash flow to enterprise value yield of 6.8% versus the benchmark’s 4.5%, and the S&P 500’s 4.1%, as is also evident in Figure 9.
Figure 10: Free Cash to EV Yield (NTM) for Distillate’s SMID QV, Russell 2000 Index and S&P 500

Lastly, we believe a similar issue is occurring with small cap stocks in the U.S. where investors are being misled on valuation by headline P/E ratios, but where there is likewise tremendous opportunity below the surface through selectivity. On the same basis of free cash flow to enterprise value yields, the Russell 2000 has been more expensive than the S&P 500 benchmark for the past 15 years (See Figure 10), but unlike the ACWI Ex-U.S. benchmark which is at long last cheaper, smaller stocks remain more expensive in aggregate. In addition, small cap stocks overall have greater debt burdens, which look particularly problematic with higher rates. Compounding these issues is the fact that over 15% of the benchmark by weight is not predicted to generate positive cash flows in the next twelve months. But beyond these risks, we see tremendous opportunity and our Small/Mid Quality Value (SMID QV) strategy offers a substantially better free cash flow yield (see Figure 10), with negligible debt and no exposure to unprofitable stocks.
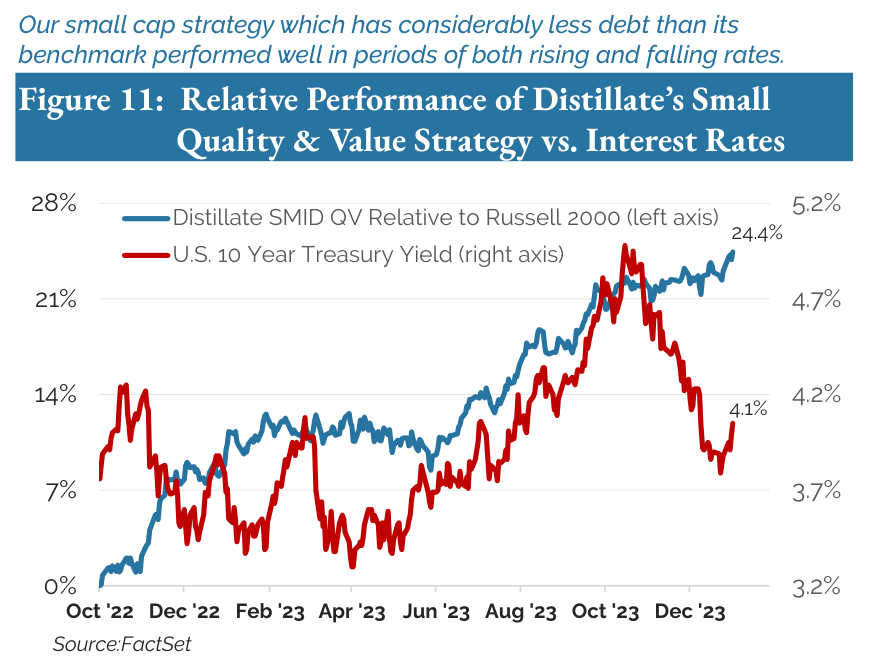
The issue of leverage is an interesting one. We were recently asked in response to our “Small Stocks Big Debt Problems” paper, how our SMID QV fund might perform relative to the more leveraged Russell 2000 benchmark if interest rates began to fall. The logic was that because our strategy has dramatically lower leverage than its benchmark, some of its recent outperformance may relate to rising rates and could reverse if interest rates began to fall. It was an excellent question and the recent sharp decline in interest rates helped to supply an answer. Figure 11 plots the relative performance of Distillate’s Small/Mid QV strategy versus the Russell 2000 ETF against the 10-year Treasury yield. While the strategy did outperform considerably in the April to October period that coincided with sharply rising rates, it also outperformed as rates fell in late ’22 and late ’23.
Figure 11: Relative Performance of Distillate’s Small Quality & Value Strategy vs. Interest Rates
A Final Word
Though we would have preferred to remain on a path to chase Bill Miller’s notable string of S&P 500-beating years of performance, we did not design our processes to outperform cap-weighted benchmarks in each quarter or each year. Rather, their architecture seeks to protect capital and take advantage of opportunities that arise. In that regard, while staying within our defined quality metrics, we remain very pleased with the absolute and relative free cash flow yields available to us in all of our strategies. There do appear to be key risks around valuation and quality in the broader benchmarks, but fortunately we are not buyers of the aggregate market but of individual stocks. To us, now in particular seems like a good time to “fish where the fish are.”
We also want to express our appreciation to you our clients that our business grew meaningfully again in 2023, with assets under management now exceeding $1.6 billion. We appreciate your partnership and confidence in what we are doing. Never hesitate to reach out should you have questions. We are better investors for the sake of the interactions we have with all of you.
Finally, please join us in welcoming John Olsen to Distillate Capital. John is joining us as a partner, having an extensive 25-year history in our industry in client-facing roles at several notable firms. We look forward to the opportunity to introduce you to John in person if we have not already done so.
Best to all of you and we wish you well in 2024!

 Q2 2024 Earnings Call Transcript")

