
t_kimura/iStock via Getty Images
Investment Thesis
AES Corporation’s (NYSE:AES) journey towards net-zero emissions is a high-stakes balancing act. With a strong push into renewable energy, the company is poised for future growth, yet faces significant financial challenges highlighted by a high debt-to-equity ratio and recent financial struggles. The transformation from fossil fuels to renewables brings both opportunities and uncertainties. While AES’s performance in the utility sector and renewables is promising, global market volatility and regulatory risks in international markets remain concerns. As a ‘hold,’ AES offers a stable dividend yield but requires cautious investment strategies. A defined risk strategy could yield returns for those adept in options trading.
Company Insights
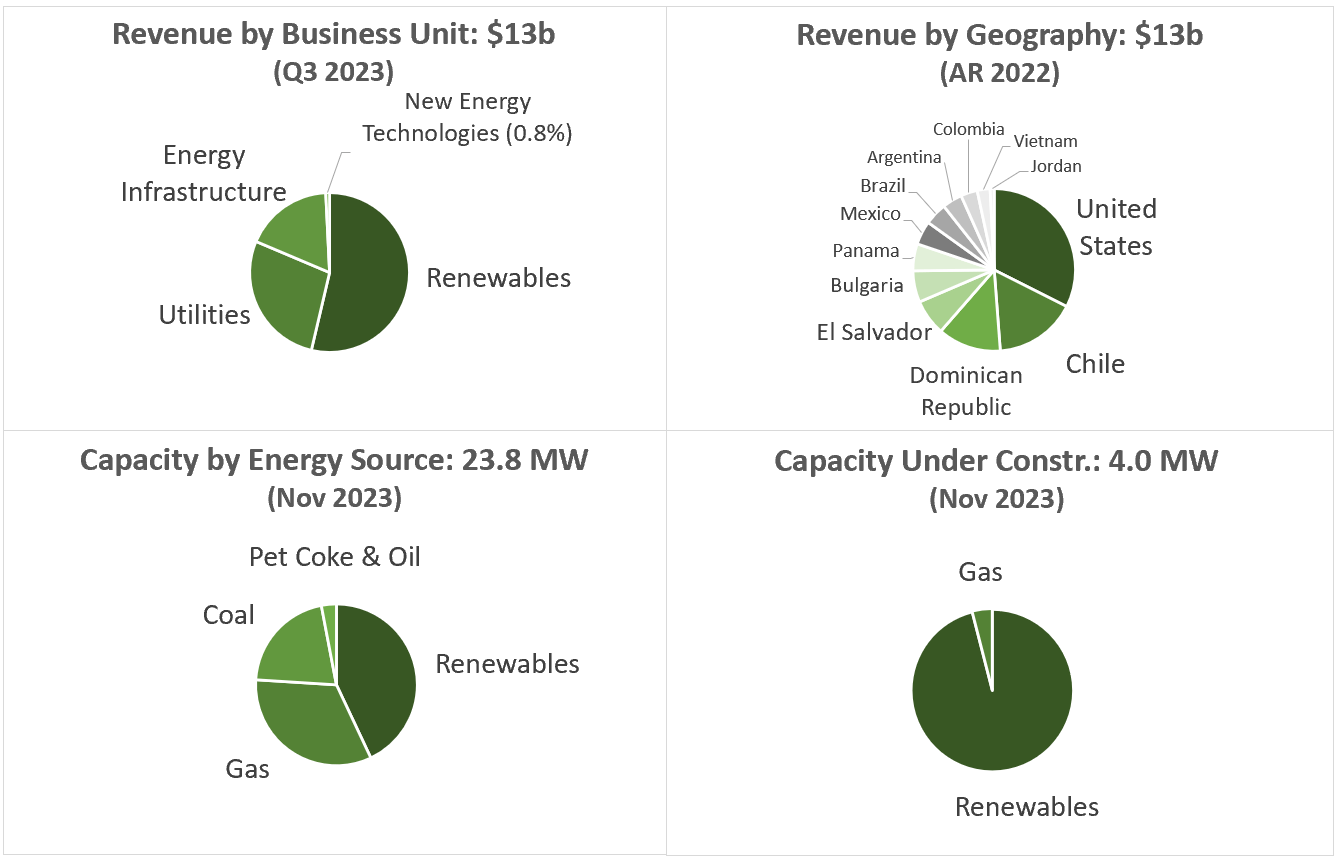
AES is a diversified power generation and utility company organized into four key Strategic Business Units (SBUs) based on technology. These are:
-
Renewables: Focused on solar, wind, energy storage, and hydro technologies.
-
Utilities: Comprising operations like AES Indiana, AES Ohio, and AES El Salvador.
-
Energy Infrastructure: Dealing with various energy sources, including natural gas, LNG, coal, pet coke, diesel, and oil. This SBU also encompasses AES’s Chilean businesses, which use a mix of generation sources.
-
New Energy Technologies: Concentrated on green hydrogen and investments in other new and innovative technologies for greener energy solutions.
See below the business in pie charts.
Analysis by: MacroDozer | Data Source: AES (SEC Filings & Investor Presentations)
AES operates across two main business lines:
-
Generation: This includes the Renewables, Utilities, and Energy Infrastructure SBUs, focusing on owning and operating power plants to generate and sell electricity to various customers such as utilities, industrial users, and intermediaries.
-
Utilities: Represented by the Utilities SBU, this division handles the generation, purchase, distribution, transmission, and sale of electricity to residential, commercial, and government sectors. It sometimes participates in the wholesale electricity market.
The New Energy Technologies SBU, though not a direct part of either business line, significantly contributes to AES’s push toward innovative and sustainable energy solutions. This effort aligns with AES’s strategic goals and its March 2023 internal management restructuring.
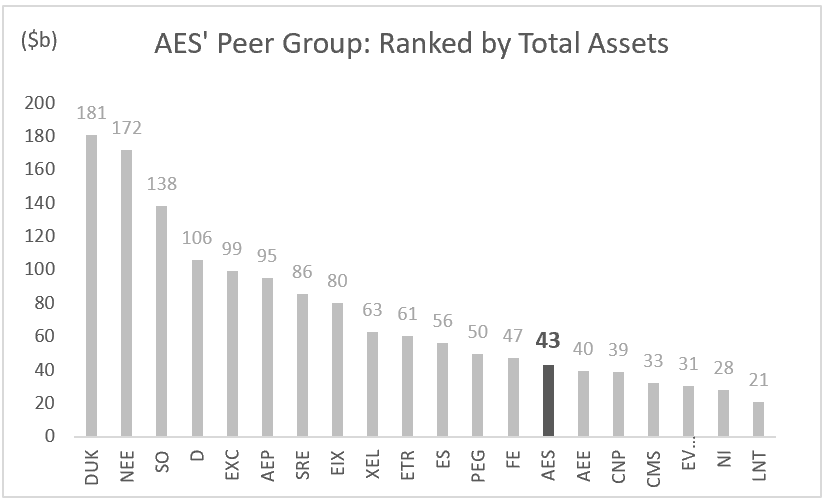
To get a feel for where AES stands within the broader context of the industry, see below for a ranking of AES and its peer group by total assets.
Analysis by: MacroDozer | Data Source: Seeking Alpha
AES’s strategy, outlined in their December 2023 investor presentation, focuses on leading the energy transition through three key initiatives:
-
Renewables: Expanding solar, energy storage, and onshore wind portfolio by 25-30 GW by 2027, maintaining global leadership in clean energy sales to corporations through PPAs.
-
Utilities: Targeting a 10% average annual rate base growth, driven by upgrading aging infrastructure and fleet transition, positioning AES among the top in the US utility sector.
-
Portfolio Transformation: Actively reducing the thermal portfolio while growing renewables and utilities, with a plan to exit most coal businesses by the end of 2025, subject to necessary approvals and maintaining reliability and affordability.
Financial Performance
Let’s examine the key financials, focusing on metrics that reveal the company’s current position and future direction and those critical to its valuation.
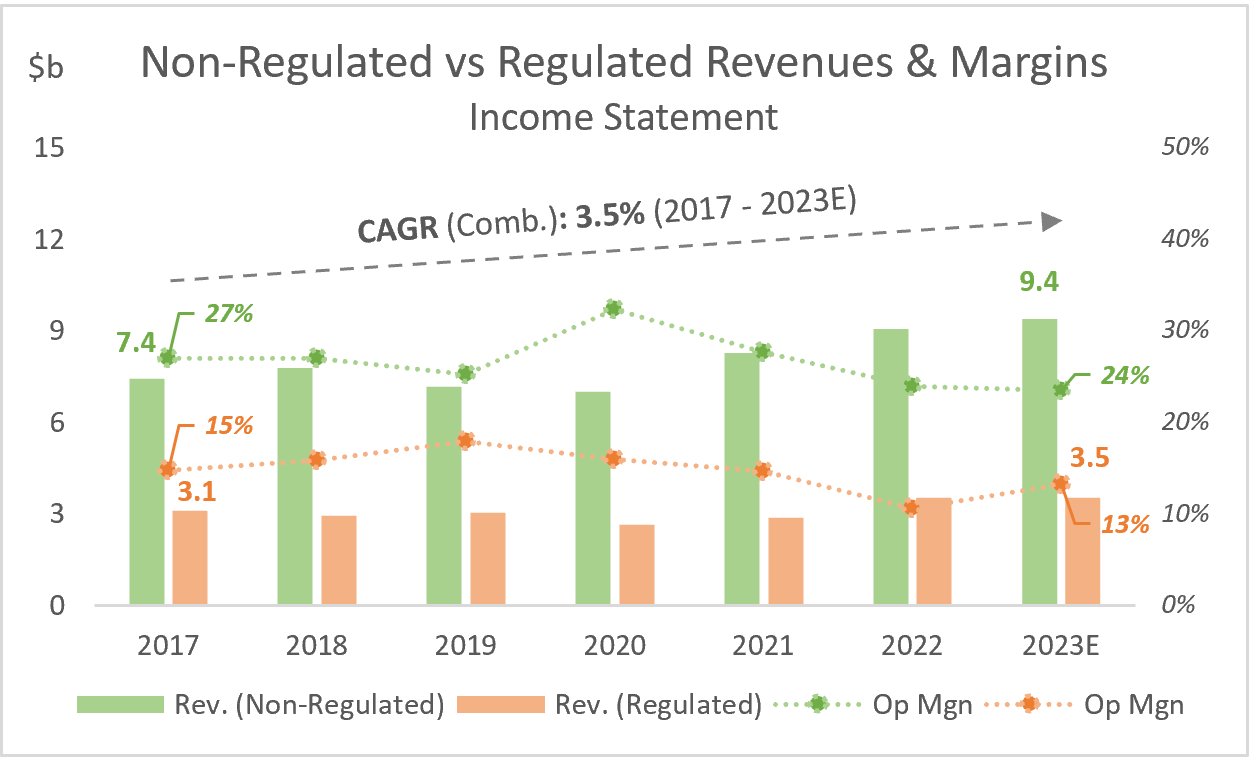
AES has demonstrated a steady annual revenue growth rate of 3.5% from 2017 to 2023. The non-regulated segment of the business exhibits stronger growth at 4.0% and nearly double the margin, with an estimated 24% for 2023, compared to 13% for the regulated business. See the following chart for more details.
Analysis by: MacroDozer | Data Source: AES (SEC Filings)
In 2021 and 2022, AES reported losses of $410 and 550 million, primarily due to significant financial challenges and the bankruptcy of its Alto Maipo hydroelectric project in Chile in 2021, resulting in a $2.1 billion write-down. In 2022, AES Andes and AES El Salvador incurred goodwill impairment expenses of $644 million and $133 million. These were attributed to higher costs and discount rates resulting from unfavorable macroeconomic conditions in Colombia and El Salvador. In 2023, a profit of $460 million is again expected.
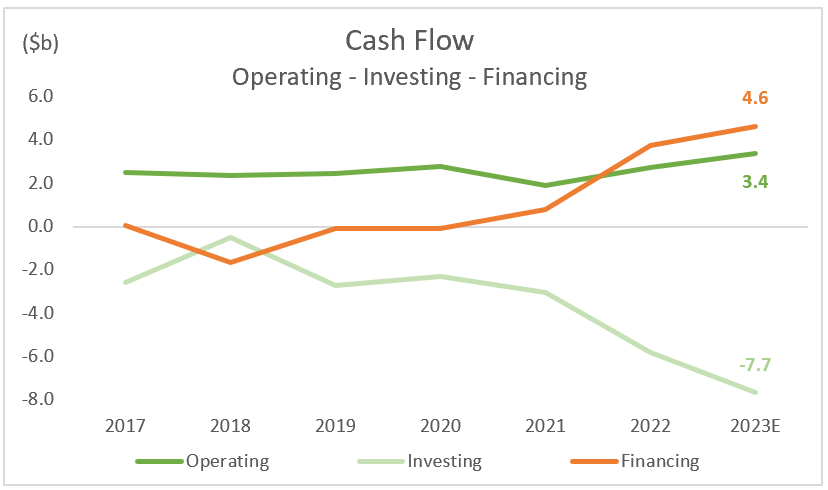
In addition to developments in income, below is a general overview of the cash flow development over the years. Overall, we can observe a steady operating cash flow and a sharp increase in cash inflow from financing activities, which has been necessary for significant investment activities over the last two years.
Analysis by: MacroDozer | Data Source: AES (SEC Filings) & Brokers’ Estimates (Koyfin)
Due to the sharp increase in external financing, AES’s debt-to-equity multiple stands at a whopping 4.1x, more than double the peer group’s average, as illustrated in the chart below. Therefore, the interest coverage, which indicates how often the business can cover interest costs with its operating income, is the lowest among peers, with 1.8x only half of the peer group’s average.
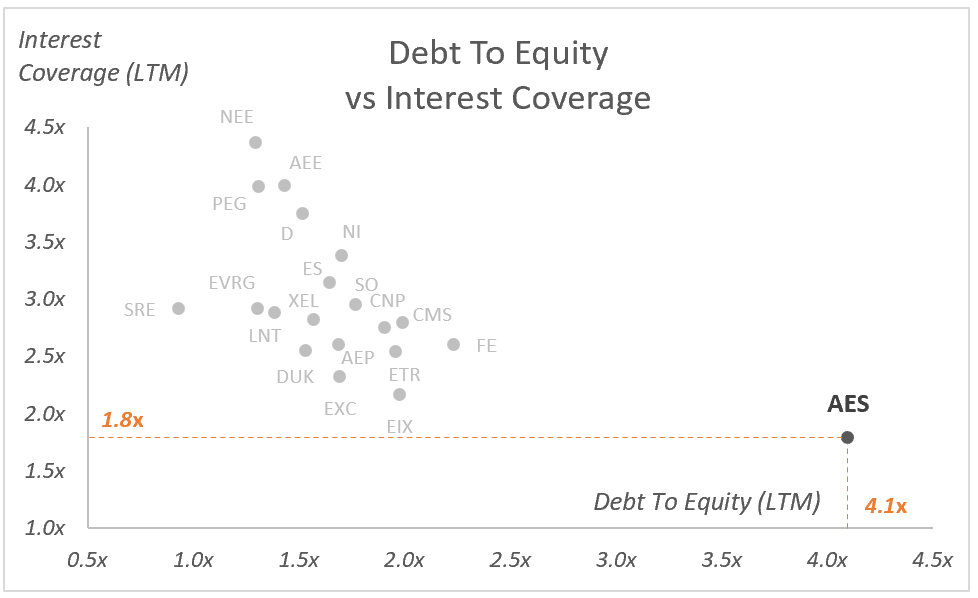
Analysis by: MacroDozer | Data Source: S&P Capital IQ
Moving on to efficiency, the subsequent chart shows AES’ expected return on equity (ROE) and asset turnover, which measures how much revenue they generate over total assets. Both figures are outstanding compared to their peers, standing at 30% and 34%.
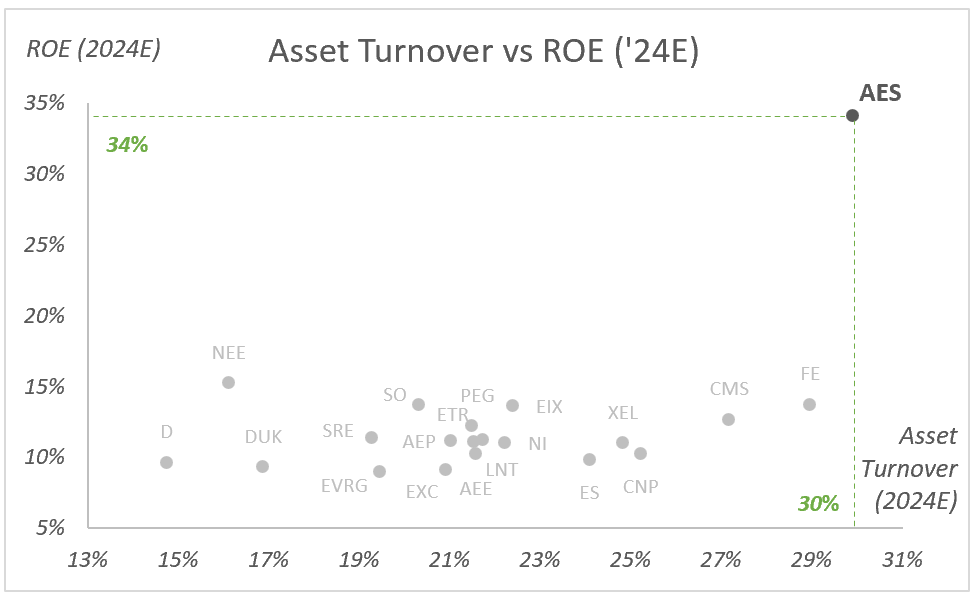
Analysis by: MacroDozer | Data Source: Koyfin
Comprehensive Analysis: Valuation, Growth, and Dividends
Growth Analysis
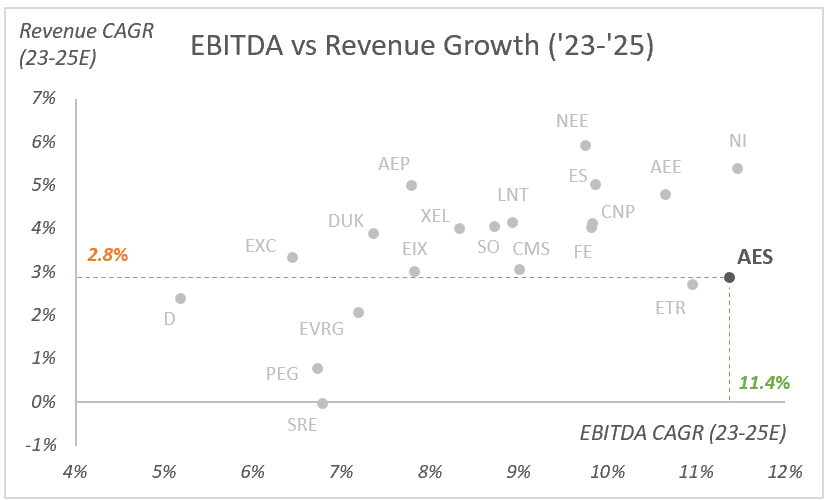
Below is a scatterplot illustrating the consensus growth estimates for AES and its peer group’s EBITDA and revenue from 2023 to 2025.
Broker estimates project AES to significantly outperform its industry peers with an 11.4% EBITDA growth, yet its projected revenue growth of 2.8% is relatively low. Reviewing the 2026 revenue estimates, only two out of nine brokers provided figures, a sample size too small for a significant analysis. However, these estimates imply that AES’s revenue CAGR might eventually align with its peers.
Analysis by: MacroDozer | Data Source: Koyfin
AES’s investor presentations forecast a 10% annual growth rate for rate bases, essentially assets, of entities like AES Indiana and AES Ohio from 2022 to 2027. These projections are cautiously approached due to the uncertainties in long-term forecasting, particularly with government policy influences. Also, this growth is balanced against AES’s commitment to reducing coal and gas usage and achieving net-zero carbon emissions in electricity sales by 2040.
We regularly review brokers’ share price forecasts and are happy to share them if they are high or low compared to the peer group. AES currently ranks first in these forecasts with a potential upside of 24%.
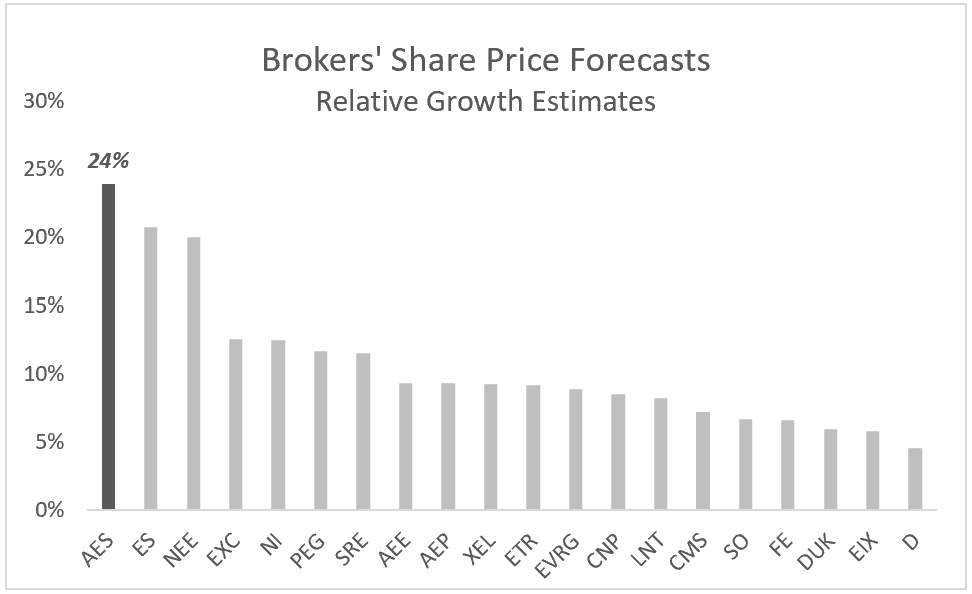
Analysis by: MacroDozer | Data Source: Koyfin
Dividend Perspective
AES’s dividend yield of 4.0% places it in the midfield among its peers, and it ranks in the 81st percentile compared to the overall US market. However, a dividend growth of 5.2% appears low, considering the company’s relatively modest payout ratio of 36%.
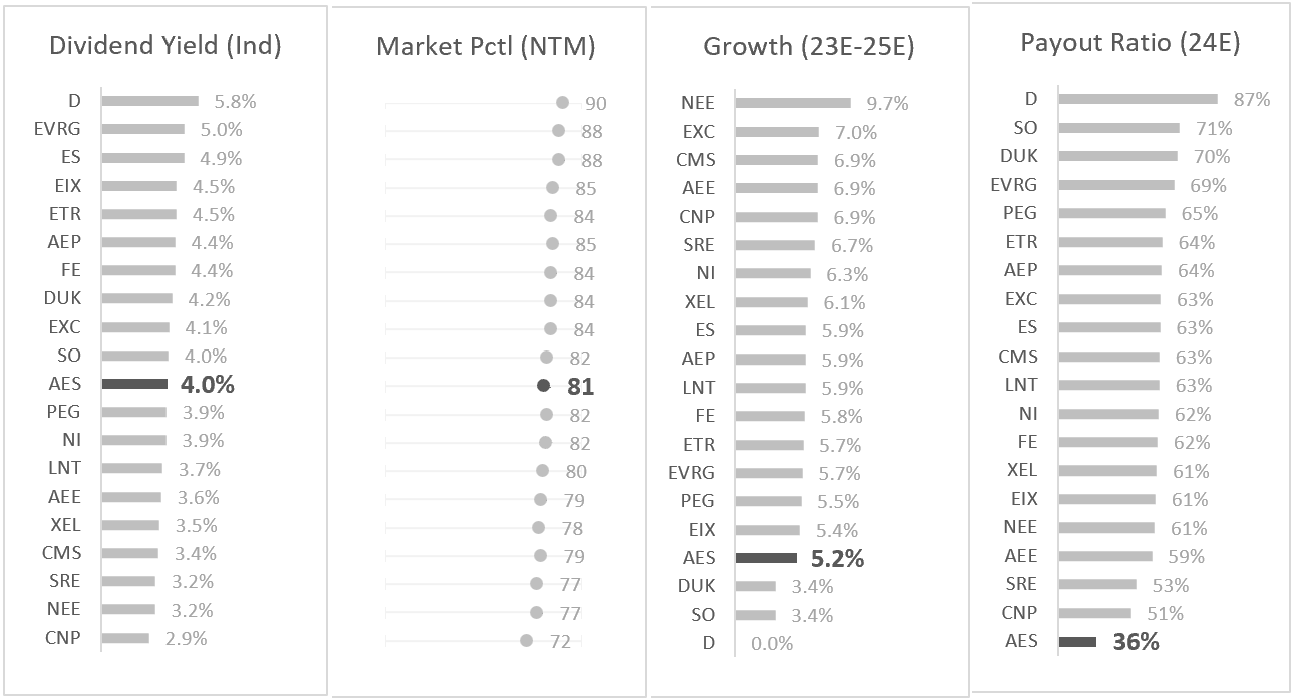
Analysis by: MacroDozer | Data Source: Koyfin
Valuation
Shifting our focus to valuation, the chart below illustrates the enterprise valuation multiples, EV/EBITDA and EV/Sales, for AES and its industry peers. The grey dots denote each company’s current trading positions, while the orange and green dots represent the 90th and 10th percentiles of the last ten years (L10Y).
Notably, most companies are trading closer to the upper end of their L10Y valuation range. AES is currently trading above the high of its L10Y EV/EBITDA multiple at the 99th percentile and close to the high of its L10Y EV/Sales multiple at the 70th percentile.
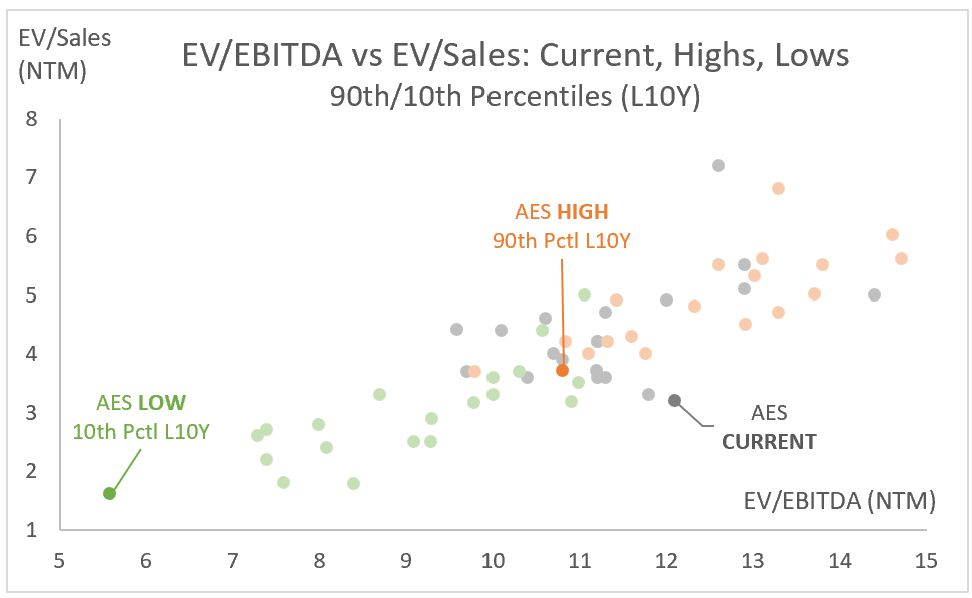
Analysis by: MacroDozer | Data Source: S&P Capital IQ
The chart below zooms into the estimated 2024 EV multiples analysis. AES trades in the middle of the EV/EBITDA range and at the lower end of the EV/Sales range relative to its industry peers, with multiples of 10.9x and 3.3x.
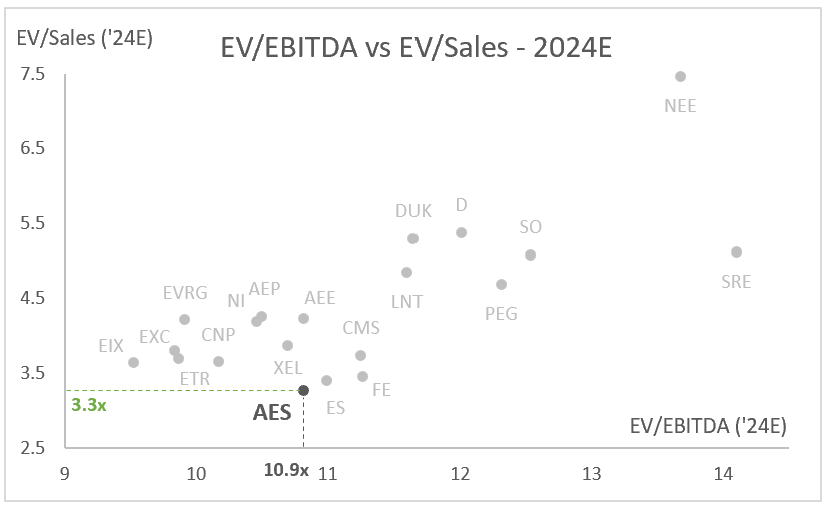
Analysis by: MacroDozer | Data Source: S&P Capital IQ
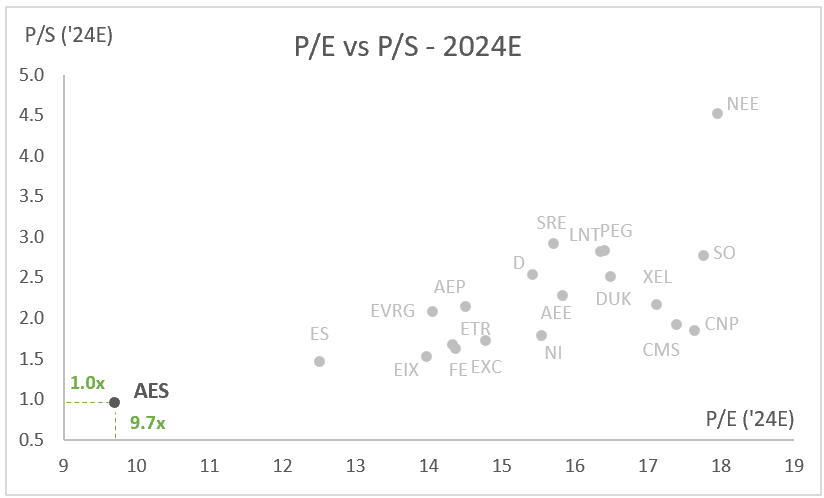
Transitioning to market value multiples, the subsequent chart outlines the price-to-earnings (P/E) and price-to-sales (P/S) valuation multiples for AES and its peers. Like the first valuation chart above, the grey dots represent the current trading positions, while the orange and green dots indicate the upper and lower valuation percentiles
In these market value multiples, which don’t factor in debt, AES trades below its 10-year low for the P/E multiple, positioned at the 8th percentile. For the P/S multiple, AES sits between the 10-year low and high, ranking at the 57th percentile.
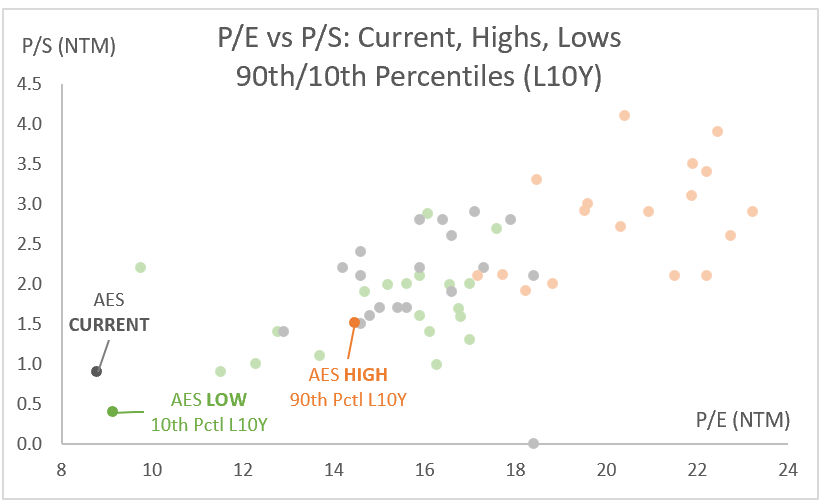
Analysis by: MacroDozer | Data Source: S&P Capital IQ
Zooming into the expected 2024 multiples, it’s evident that AES is trading at significantly lower levels on both metrics compared to its peer group, with a P/E ratio of 9.7x and a P/S ratio of 1.0x.
Analysis by: MacroDozer | Data Source: S&P Capital IQ
Verdict
The management does not seem immune to suboptimal investment decisions, which is understandable when exposed to emerging markets and pursuing a net carbon zero goal within a relatively tight deadline. This was evident in AES’s experience in 2021 with the Alto Maipo hydroelectric project in Chile, resulting in a $2.0 billion write-down, followed by a further $800 million in impairment expenses in 2022 at AES Andes and El Salvador. Such issues could continue in the coming years. We believe a highly leveraged company not immune to suboptimal investment decisions should be traded at a discount compared to its more conservative peers.
Others might argue, ‘Why not have it trade at a premium? Clean energy is the future, and AES is at the forefront with a compelling investment story.’ We’d rather stick to the numbers and see how things play out over the next decade.
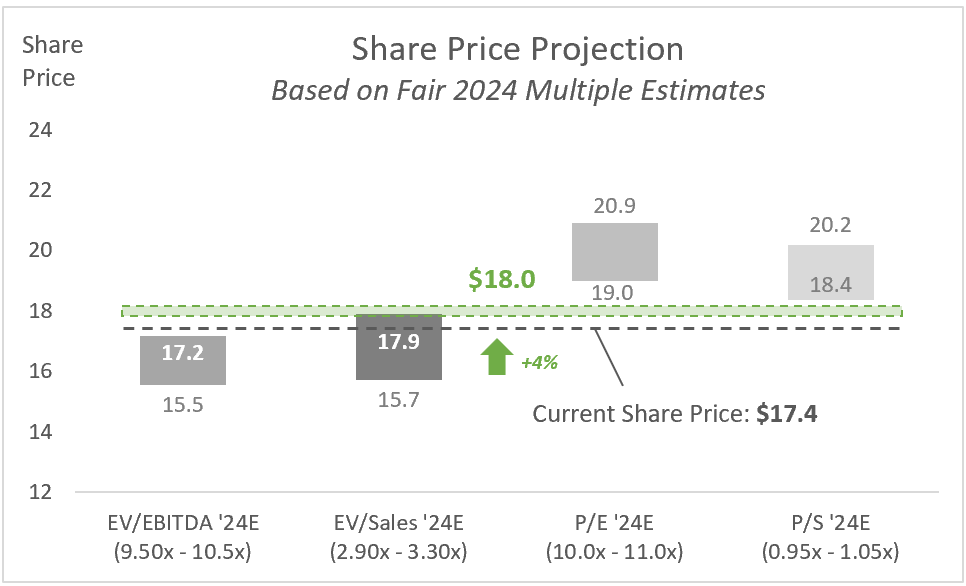
Drawing from our analysis of standalone performance, peer comparison, and multiple expansion & contraction, we propose the following multiple ranges as the basis for setting a 2024 price target for the company:
EV/EBITDA ‘24E: 9.50x-10.5x
EV/Sales ‘24E: 2.90x-3.30x
P/E ‘24E: 10.0x-11.0x
P/S ‘24E: 0.95x-1.05x
We now apply those multiples to today’s share price to determine a fair price range for each metric, as seen in the chart below. Ultimately, we suggest a share price target of $18.00, representing an upside of +4% from today’s price.
Analysis by MacroDozer
Risk Assessment
Global Market Volatility and Energy Transition Risks
-
The inherent volatility of developing economies significantly impacts AES. This exposure leads to fluctuating commodity and currency markets.
-
The company’s accelerated shift from fossil fuels towards renewable energy sources to achieve net carbon zero by 2040 introduces significant uncertainties, potentially impacting earnings and cash flows.
Credit Market Sensitivity
-
Tight credit markets pose a challenge for financing growth. AES’s reliance on its credit ratings for competitive financing is crucial, where a downgrade could have significant impacts.
-
Current ratings are BBB- by Standard & Poor’s and Baa3 by Moody’s.
International Operations and Regulatory Challenges
-
AES faces political and economic instability risks and regulatory unpredictability, particularly in Latin America, leading to revenue and earnings volatility.
-
Dependence on a few key customers for power purchase agreements poses a risk to stable cash flows and operations.
Project-Specific and Regional Operational Risks
-
The Alto Maipo project’s experience underscores the potential for financial losses and complexities in global project financing and management.
-
Recent liquidity challenges in AES Puerto Rico highlight operational risks in specific regions, emphasizing the necessity of adept risk management for financial stability.
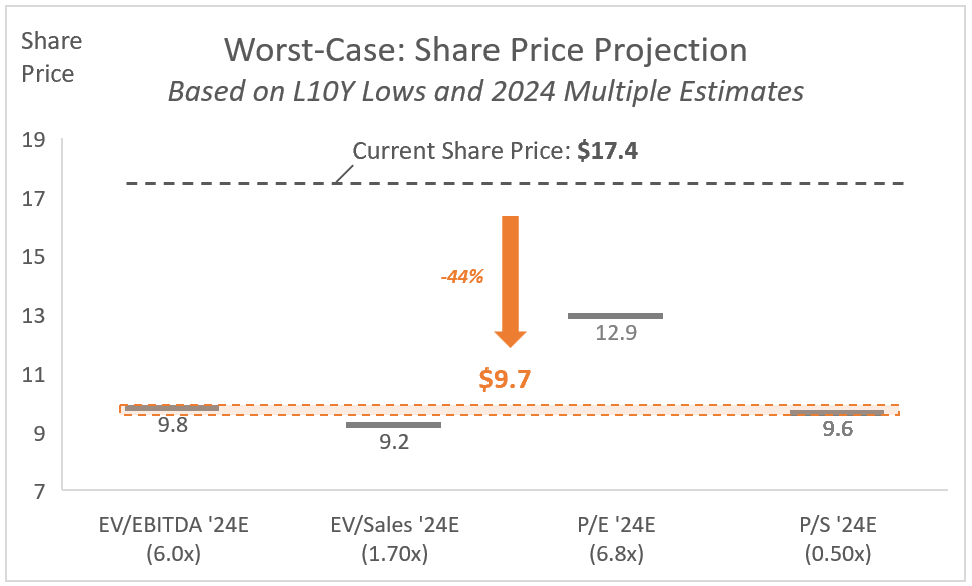
Worst-Case: Share Price Projection
Our worst-case analysis indicates a potential 44% decrease in AES’s share price to $9.7, based on conservative multiples from historical lows during challenging periods. This projection, detailed in the chart below, considers the abovementioned risks.
Analysis by MacroDozer
Trade Execution – Top Idea
Despite collecting dividends, few ways with decent risk-return profiles exist to profit from an asset considered a ‘hold’ and not expected to move much on average in the mid-run.
We have found a method with defined risk to generate returns through a straightforward options strategy that invests in sideways movement over the coming months. This approach is suitable only for professionals experienced in options trading; others should stick to holding and collecting the dividend and consider gradually increasing the position if a sharp share price decline occurs without any changes in the fundamental data.
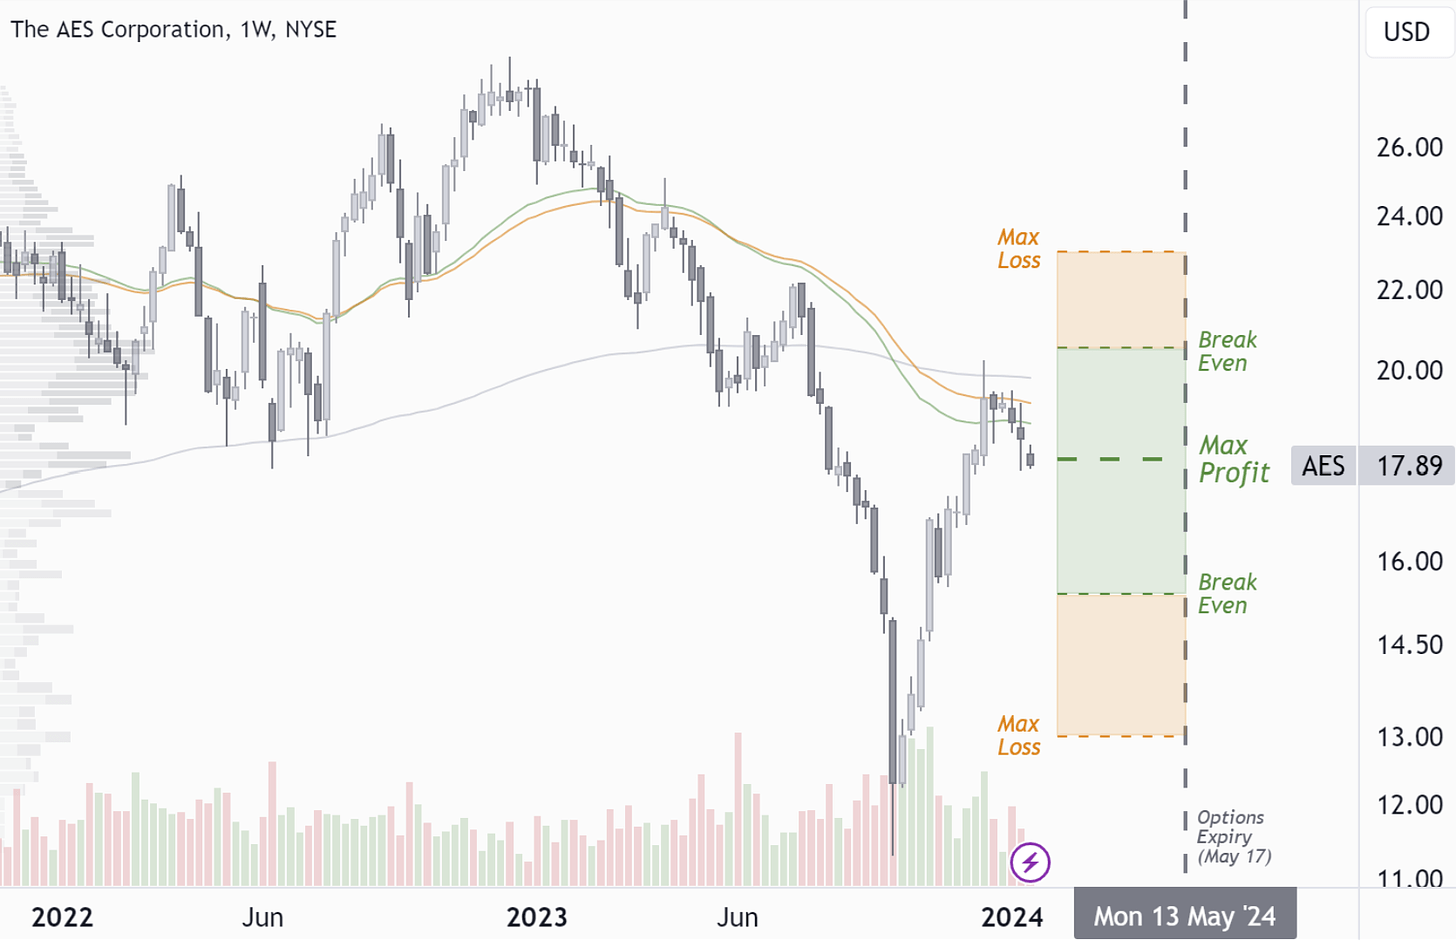
Analysis by: MacroDozer | Data Source: TradingView
One way is to sell a risk-defined straddle (Iron Butterfly) at our target share price of $18.00, with hedges at $13.00 and $23.00, maturing on May 17, 2024. Break-even points are at $15.50 and $20.50, with maximum losses at each hedge. The risk-return ratio is 1:1, and the investment should be closed a few weeks before maturity or when a return on investment of 25% to 35% is achieved.
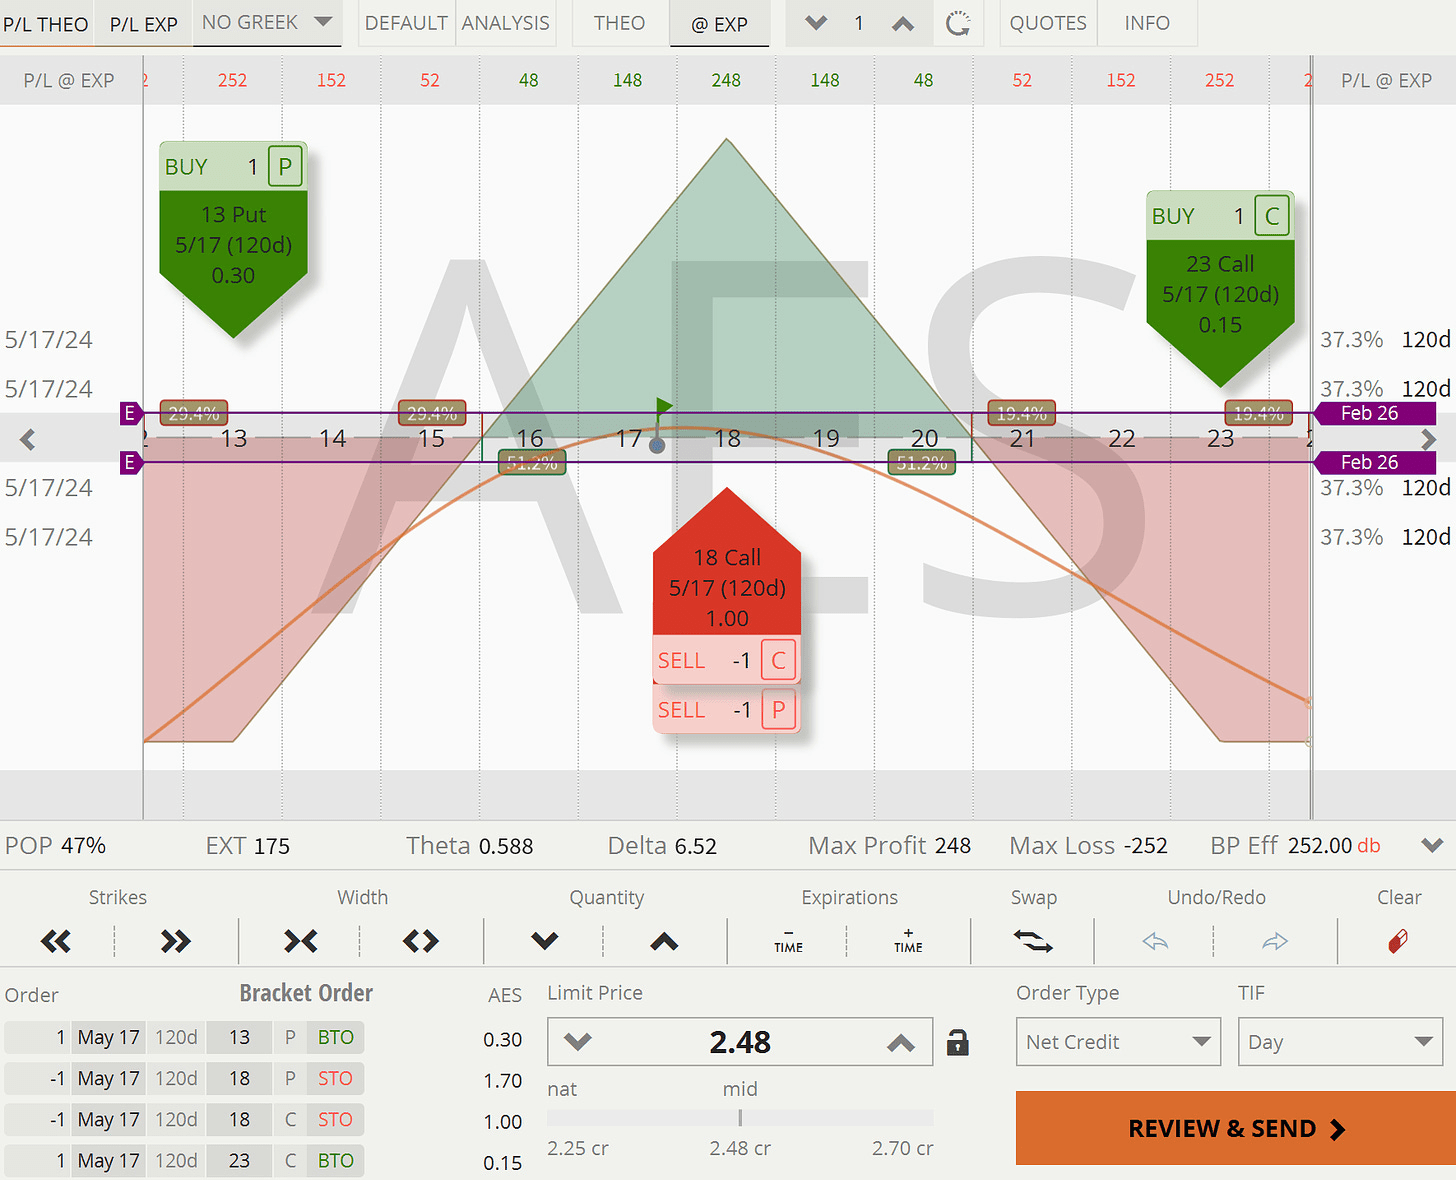
Analysis by: MacroDozer | Data Source: tastytrade
Conclusion
AES Corporation’s ambitious journey towards a net-zero future presents a complex investment landscape. Weighing the potential for growth in the renewable energy sector against significant financial headwinds, such as a high debt burden and operational challenges, AES presents opportunities and risks. While the company’s clean energy efforts and strategic initiatives are commendable, investors must grapple with the uncertainties of volatile markets and regulatory environments, particularly in emerging markets. With AES rated as a ‘hold’ and its share price currently reflecting a perfect balance between its opportunities and risks, investors can only benefit from AES’ stable dividend yield and, with some expertise, explore option strategies suitable for perfect pricing.

 Q2 2024 Earnings Call Transcript")

