monsitj/iStock via Getty Images
A Good Year
Following a difficult 2022 in the financial markets our firm was positive on the equity markets for 2023 as we outlined in our newsletter one year ago. We highlighted the fact the Federal Reserve’s numerous interest rate increases and consequent equity market correction likely created a buying opportunity for investors. In our Winter 2020 Investor Letter we wrote how the COVID pandemic might just lead to a roaring 20’s type market environment, like the market after the Spanish flu pandemic.
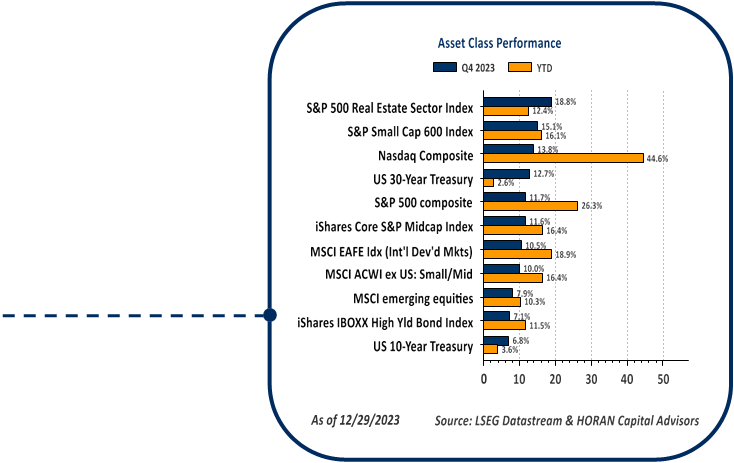
So here we are today looking back at 2023 and stocks around the world have mostly generated strong returns. A clear standout in return is the Nasdaq Composite Index (COMP.IND), heavily weighted in the Magnificent Seven stocks. The Nasdaq Composite is concentrated in three sectors, Information Technology (Apple, Microsoft, NVIDIA), Consumer Discretionary (Amazon, Tesla) and Communications Services (Alphabet, Meta Platforms) with the three sectors representing over 76% of the index. In the fourth quarter we began to see a broadening out in the markets as small company stocks (SP600, S&P Small Cap 600 Index) were up 15.1% in the quarter and the S&P 500 Real Estate Sector was up 18.8%, erasing all the loss incurred in the first three quarters of the year. Also outperforming the S&P 500 Index in the fourth quarter was the Equal Weight S&P 500 Index which was up 11.87% versus the S&P 500 Index return of 11.69%. A small difference but further indication of an equity market where more stocks participated in the rally in the latter part of 2023. This is a healthy sign that could serve as a catalyst for additional gains in 2024.
The Focus Remains on The Fed
The Fed’s eleven interest rate hikes from near zero percent in 2022 to 5.5% by July 2023 was the fastest pace of increase on record. The interest rate increases in this cycle have returned rates back to a more normal level. Going back to 1954 the average Fed Funds rate equals 4.6%, just below the current level of 5.5%. This rapid rise in rates certainly was a catalyst for the weak market return in 2022, both in bonds and stocks. In July of 2023 the Fed’s commentary provided investors with an indication that rate hikes were nearly done if not done entirely this cycle and rate cuts would soon follow. In fact, the market expects the first interest rate cut at the Fed’s March 2024 meeting.
The maroon line on the near chart shows the headwind rate hikes created for stocks in 2022 as well as the subsequent recovery in 2023 that more than erased the 2022 losses.
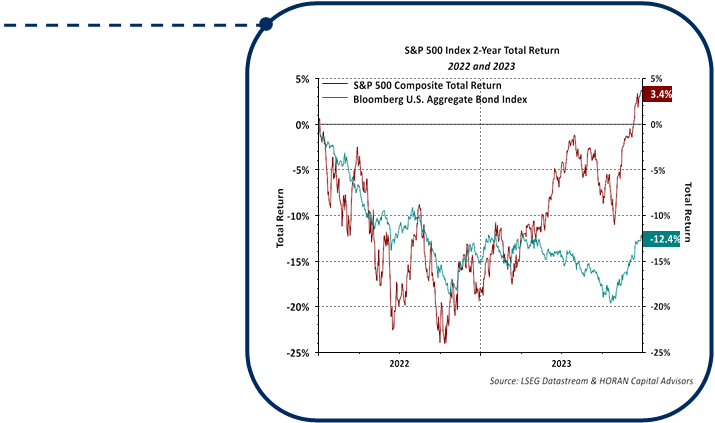
Bonds on the other hand, remain negative by 12.4% over the two-year period. However, if anticipated rate cuts become a reality, bonds could generate positive returns and continue their recovery in 2024. We believe the economy is doing reasonably well and does not need a rate cut that would serve as further stimulus. Pent up demand remains, following the pandemic shutdown in 2020, for example, in travel and leisure, as well as services and consumer experience demand, etc. Certainly, rate cuts may be in store in the coming year, but drastic reductions are likely not necessary. The market is anticipating a Fed Funds rate at 4% by November of 2024, but we believe this is an aggressive target based on the current strength of the economy. In short, we do not anticipate a recession for the U.S economy in 2024, at least based on the data we evaluate today.
Bonds have now become much more attractive for investors with available yields returning to levels last seen roughly 15 years ago, prior to the great financial crisis.
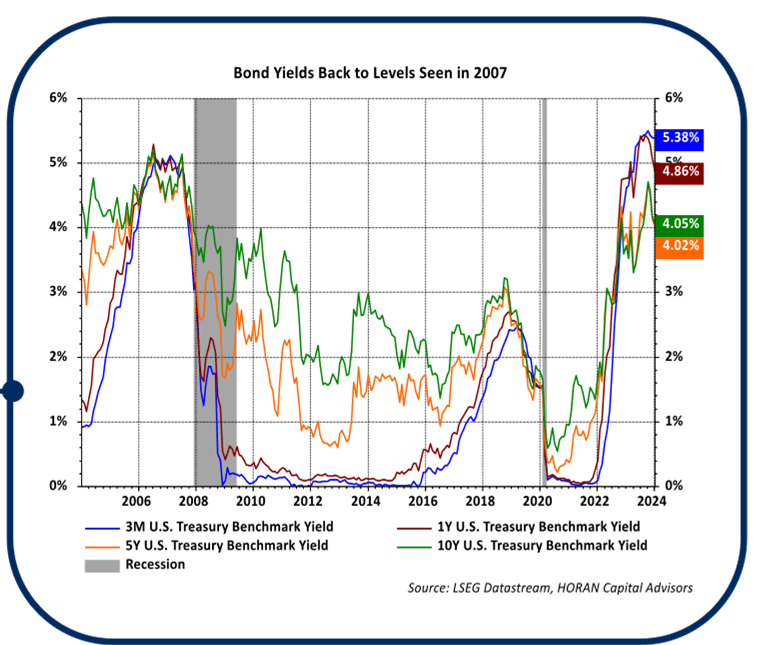
Investors are beginning to enjoy income flowing from bonds and cash that is filling consumer pockets and further stimulating spending and investment. We have begun taking advantage of the higher yields by adding to bonds in investment portfolios.
A Presidential Election Year
With the strong equity market returns achieved by investors in 2023 and a seemingly uninterrupted advance in the fourth quarter, a higher level of volatility in the first quarter would not be a surprise. Additionally, the U.S. has entered a year where a presidential election will be held. As the green line on the near chart shows, when a sitting president is running for reelection, the equity market tends to be volatile up until around May.
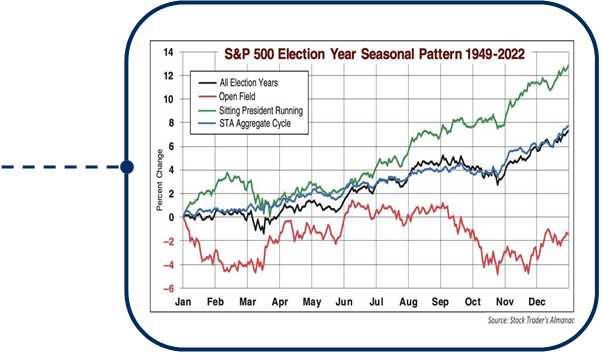
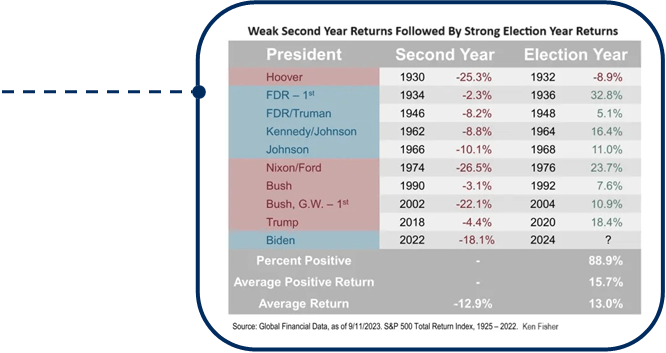
Following May though, a strong advance has historically unfolded, partly due to a lessening of the uncertainty surrounding the election’s potential outcome. Additionally, both political parties want to be reelected so they tend to pursue actions that are supportive to the economy and voters. Also, as noted in a recent article in the NY Post by Ken Fisher, when the market is weak in a president’s second year, the equity market return in the election year has been largely positive, averaging 15.7%.
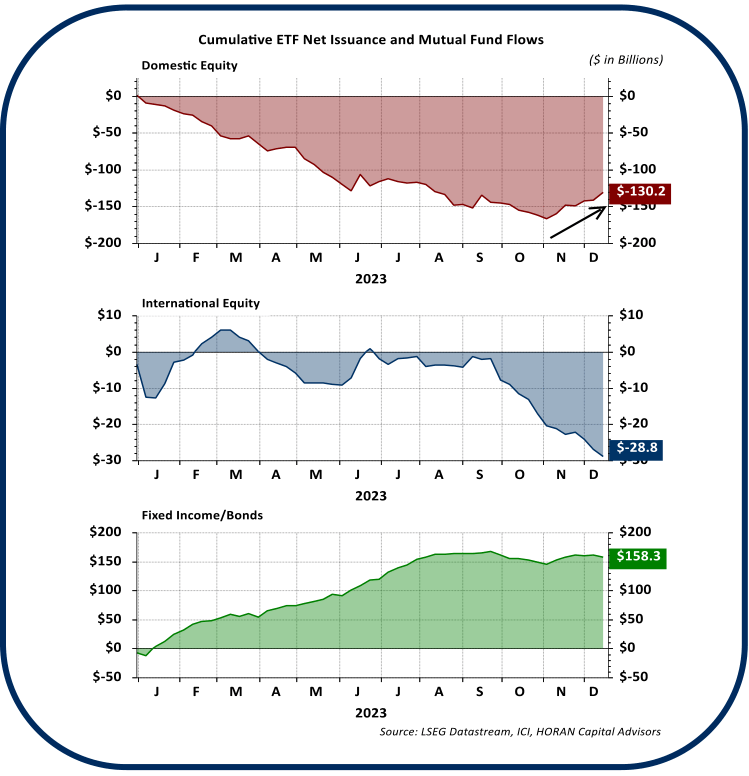
Along with being in a favorable election cycle period, investor fund flows into equity mutual funds and exchange traded funds (ETF’s), specifically U.S. equity flows, have turned positive after being strongly negative for most of 2023. As seen on the chart on the next page. This positive fund flow is evidenced by the upward sloping maroon line since the end of October. Flows into U.S. equity funds and ETF’s were a positive $33.0 billion in November and December. From a contrarian perspective, these strong flows can be viewed with potential caution if investors are viewed as being more bullish on stocks, which tends to occur late in a bull market cycle. One frequently cited sentiment indicator is the American Association of Individual Investor’s weekly Sentiment Survey. Last week’s bullishness reading was reported at 46.3%, down from the prior week’s 52.9%. The less volatile 8-week moving average stands at 47.3% and is approaching an excessive bullishness level.
Opportunity Ahead
The three S&P 500 sectors that contain the Magnificent Seven stocks, Information Technology, Consumer Discretionary and Communication Services, generated 21.7 percentage points of the S&P 500’s 2023 return of 26.3%. This narrowness of return has created opportunities in areas outside of the mega cap stocks that generated most of the market return in 2023. One such area is in the small company stock space. Our firm has not had exposure to small company stocks since late 2013 and small cap stocks, as measured by the S&P Small Cap 600 Index, have significantly underperformed large company stocks since that time, i.e., generating just half the return generated by the S&P 500 Index. Late in Q3 2023 we began to add small company stock exposure to client portfolios; thus, capturing the strong Q4 rebound. Small company stocks continue to trade at near historically low relative valuations to large cap stocks. Additionally, earnings growth for small company stocks in the Russell 2000 Index is expected to be up 17% in 2024 and a further 32% in 2025. Small cap stocks tend to be more volatile than their larger stock counterparts, but the risk/reward for small company stocks seems favorable as 2024 gets underway.
Thank you for your continued confidence and support in HORAN Capital Advisors and we are always available to answer your questions and discuss our outlook further. Please be sure to visit us for company news, reports, and our blog at Insights.
|
HORAN Capital Advisors, LLC is an SEC Registered Investment Advisor. The information herein has been obtained from sources believed to be reliable, but we cannot assure its accuracy or completeness. Neither the information nor any opinion expressed constitutes a solicitation for the purchase or sale of any security. Any reference to past performance is not to be implied or construed as a guarantee of future results. Market conditions can vary widely over time and there is always the potential of losing money when investing in securities. HCA and its affiliates do not provide tax, legal or accounting advice. This material has been prepared for informational purposes only, and is not intended to provide, and should not be relied on for tax, legal or accounting advice. You should consult your own tax, legal and accounting advisors before engaging in any transaction. For further information about HORAN Capital Advisors, LLC, please see our Client Relationship Summary at IAPD – Investment Adviser Public Disclosure – Homepage. |
Editor’s Note: The summary bullets for this article were chosen by Seeking Alpha editors.

 Q2 2024 Earnings Call Transcript")

