J Studios/DigitalVision via Getty Images
Dear readers,
My last article on the S&P 500 (NYSEARCA:SPY) from early December was titled New All-Time Highs Before A Major Sell-Off. In that article, I argued that over the short-term the index was likely to carry the positive momentum from the year-end rally into 2024, reaching new all-time highs in the process. Then, over the medium to long term I expected a (mild) recession to materialize, as a result of aggressive tightening by the Fed, sparking a substantial sell-off in the markets.
So far, the thesis has played out as expected with the S&P 500 at 4,750 points at the time of writing this article, just shy of the all-time high and up 3.5% since the last article. I continue to be somewhat bullish in the short term, fully expecting the index to surpass the all-time high and perhaps reach 5,000 points. But I remain bearish in the long term. In this article I want to provide further historical evidence that supports the thesis, as well as incorporate the latest macroeconomic data.
Short-term forecast
I don’t often include technical analysis in my articles, but I think it’s important to provide context here as we find ourselves at a key technical level not too different from the October 2022 low.
Markets follow liquidity and more often than not a major reversal is sparked by a liquidity hunt such as the one seen in October 2022, below the previous range low.
Now that we’re near the range high, does that automatically mean that a reversal is likely?
No.
But what is likely is that the index is going to surpass the all-time high at 4,810 points, at least briefly.
It’s likely, because even if the trend is to reverse, market makers would likely first want to capture the liquidity above the range high, pushing the price up from here before changing course.
TradingView author’s analysis
Beyond the technicals, I see two further reasons to be bullish in the short term.
First, the fundamentals remain strong.
Inflation is largely under control, despite a slightly hotter than expected CPI read in December of 0.3% month-over-month and 3.4% YoY. And more importantly it is destined to decline further in 2024. The reason is that shelter CPI continues to be reported at 6.2% YoY, despite the national rent index seeing negative month-over-month change in each of the past eight months. It is therefore only a question of time, before we work through the lag and headline CPI declines closer to the Fed’s 2% target.
U.S. Bureau of Labor Statistics, CNBC
In the meantime, the economy remains strong with the highest GDP growth since Q4 2021 of 4.9% YoY. Notably, this economic growth was mainly fuelled by consumer spending which alone added 2.7% of growth, showing evidence that the consumer has yet to weaken.
Chart: YoY GDP growth
Trading Economics
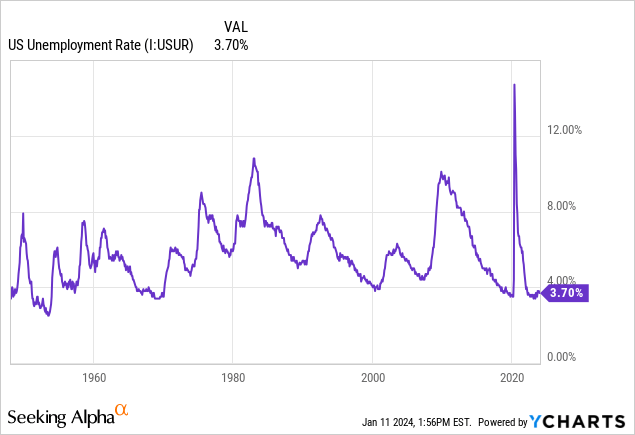
Finally, unemployment remains at historically low levels, showing no signs of a recession. Here I want to point out that things always seem bright right before something breaks and so while the labor market remains very tight for now, there is no guarantee that this will continue.
Second, historically speaking a Fed pause is bullish for stocks and a sell-off usually only comes when the Fed cuts rates (more on this later). Over the past three cycles, stocks have, on average, risen by 5.3% during a Fed pause, with 2007 seeing gains of as much as 22%.
Ria SimpleVisor, Investing.com
Long-term forecast
While markets rely on momentum in the short term, over the long term they’re almost exclusively driven by earnings and valuation.
Currently, S&P 500 earnings estimates for 2024 are quite aggressive at $245 per share, up 11% from last year. The trailing P/E multiple stands at 21x and the forward P/E at 19.5x, both significantly above long-term averages.
Chart: S&P 500 P/E ratio
Macrotrends
And while an aggressive forecast and an expensive valuation don’t necessarily mean that a sell-off is likely, it does mean that the risk-reward is poor. There are studies that look at the correlation between valuation and subsequent market returns and predict sub-par 5% annual returns over the next five years. That’s not much considering that there is a real risk of a 20% downside (calculated in my previous article) if the economy falls into a recession.
J.P.Morgan Asset Management
Moreover, there are other factors that suggest that a sell-off might occur in the second half of this year.
The yield curve is inverted, which has accurately predicted recessions in 1970, 1975, 1980, 1982, 1991, 2001, 2009 and 2020 with an average lead-time of 24 months. Since the yield curve inverted in May 2022, that puts the expected start of a recession to May of this year.
FRED
It would be foolish to think that a recession could somehow be bullish for the stock market. That’s never the case and is the reason why a major sell-off in the markets usually coincides with the timing of Fed rate cuts that are meant to stimulate the declining economy.
In fact, over the past nine cycles dating all the way back to 1974, the S&P 500 has fallen, on average, by 20.5% following the first rate cut. Such a decline would correspond to my 2024 S&P 500 target of 3,750 points and, in my opinion, would create a great buying opportunity.
Importantly, the low is barely ever reached right away with an average time between the first rate cut and the market low of 276 days. That means that if the future plays out similarly to the past, we might not see a low on the S&P until early to mid-2025.
Strategas, Bloomberg
Bottom Line
Once again, I recognize that timing the market is not possible, and we don’t know what the future holds.
In either case, I continue to be bullish in the short-term mainly due to momentum and technicals and bearish in the long-term due to a poor risk-reward of the index and a possibility of a major market sell-off sparked by a recession.
I’m staying invested, but prefer higher dividends and more defensive sectors than the tech-heavy S&P 500.

 Q2 2024 Earnings Call Transcript")

