Khanchit Khirisutchalual
XMHQ strategy
Invesco S&P MidCap Quality ETF (NYSEARCA:XMHQ) started investing operations on 12/01/2006 and tracks the S&P MidCap 400 Quality Index. It has 81 holdings, a 12-month dividend yield of 0.74%, and an expense ratio of 0.33%. Distributions are paid quarterly.
The starting universe is the S&P MidCap 400 Index. As described by S&P Dow Jones Indices, a quality score is calculated based on an average of the Z-scores of three fundamental ratios:
- Return on Equity, calculated as trailing 12-month earnings per share divided by current book value per share.
- Accruals Ratio, calculated as the change in net operating assets over the last fiscal year divided by average total assets over the last two fiscal years.
- Financial Leverage Ratio, calculated as total debt divided by book value.
Outliers are winsorized to avoid distortion by extreme values. The 80 best-ranked securities are included in the index. Weights are calculated as the product of market capitalization and quality score, with a maximum of 5% in any constituent and 40% in any sector. The index is rebalanced semi-annually with a 20% buffer rule to reduce portfolio turnover. In the most recent fiscal year, the turnover rate was 79%.
XMHQ portfolio
The fund invests almost exclusively in U.S. companies (99% of assets), about 47% mid-caps and 53% small-caps, according to Fidelity classification. The portfolio is very heavy in industrials (30.9%). Compared to the parent index, represented in the next chart by SPDR S&P MidCap 400 ETF (MDY), XMHQ overweights mostly industrials and energy. It underweights healthcare, almost ignores real estate, and passes over communication and utilities.
Sector breakdown (chart: author, data: Invesco, SSGA)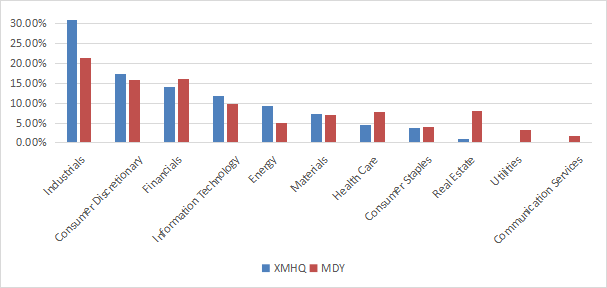
The portfolio is well-diversified across constituents. The top 10 holdings, listed below, represent 25.7% of assets and none of them is over 3.5%, so risks related to individual companies are moderate.
|
Ticker |
Name |
Weight% |
EPS growth %ttm |
P/E ttm |
P/E fwd |
Yield % |
|
Manhattan Associates, Inc. |
3.48 |
50.78 |
75.33 |
56.65 |
0 |
|
|
Deckers Outdoor Corp. |
3.28 |
41.35 |
28.14 |
27.31 |
0 |
|
|
Williams-Sonoma, Inc. |
2.73 |
-12.61 |
13.61 |
13.49 |
1.84 |
|
|
Reliance Steel & Aluminum Co. |
2.71 |
-22.20 |
11.67 |
12.75 |
1.44 |
|
|
Super Micro Computer, Inc. |
2.69 |
32.76 |
26.96 |
16.80 |
0 |
|
|
Carlisle Cos., Inc. |
2.47 |
-11.99 |
21.30 |
20.60 |
1.11 |
|
|
Watsco, Inc. |
2.16 |
8.72 |
27.24 |
29.00 |
2.41 |
|
|
Celsius Holdings, Inc. |
2.10 |
164.14 |
116.33 |
74.37 |
0 |
|
|
Owens Corning |
2.07 |
-4.58 |
11.37 |
10.59 |
1.63 |
|
|
Graco, Inc. |
2.06 |
16.05 |
27.38 |
27.40 |
1.23 |
Ratios from Portfolio123.
Performance
As reported in the next table, return and risk metrics since inception are almost on par with the S&P MidCap 400 Index.
|
Since 12/4/2006 |
Total Return |
Annual Return |
Drawdown |
Sharpe ratio |
Volatility |
|
XMHQ |
314.57% |
8.67% |
-58.20% |
0.5 |
17.96% |
|
MDY |
311.91% |
8.63% |
-55.33% |
0.49 |
18.89% |
However, XMHQ has outperformed the benchmark by 13% in the last 12 months.
XMHQ vs. MDY, last 12 months (Seeking Alpha)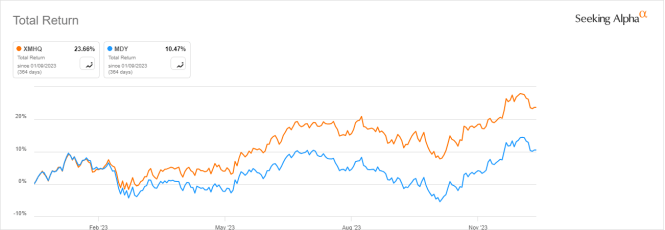
In previous articles, I have shown how three factors may help cut the risk in a dividend portfolio: Return on Assets, Piotroski F-score, and Altman Z-score.
The next table compares XMHQ since 7/1/2006 with a subset of the S&P 500 (SP500): stocks with an above-average dividend yield, an above-average ROA, a good Altman Z-score, a good Piotroski F-score and a sustainable payout ratio. The subset is rebalanced annually to make it comparable to a passive index.
|
Total Return |
Annual Return |
Drawdown |
Sharpe ratio |
Volatility |
|
|
XMHQ |
314.57% |
8.67% |
-58.20% |
0.5 |
17.96% |
|
Reference subset |
653.35% |
12.54% |
-39.52% |
0.78 |
15.44% |
Past performance is not a guarantee of future returns. Data Source: Portfolio123.
The dividend quality subset outperforms XMHQ by 3.9% in annualized return and shows a lower risk measured in drawdown and volatility. However, the fund’s performance is real and this subset is simulated. My core portfolio holds 14 stocks selected in this subset (more info at the end of this post).
Fundamentals
Valuation metrics are mixed. XMHQ is cheaper than MDY regarding the price-to-earnings ratio, but more expensive in price/book and price/sales, as reported in the next table.
|
XMHQ |
MDY |
|
|
Price/Earnings TTM |
11.31 |
14.63 |
|
Price/Book |
3.37 |
2.15 |
|
Price/Sales |
1.51 |
1.21 |
|
Price/Cash Flow |
10.32 |
9.8 |
I have scanned holdings with the quality metrics described in the previous paragraph. I consider that risky stocks are companies with at least 2 red flags among: bad Piotroski score, negative ROA, unsustainable payout ratio, bad or dubious Altman Z-score, excluding financials and real estate where these metrics are less relevant. With these assumptions, 3 stocks out of 79 are risky and they weigh only 3.9% of asset value, which is a very good point.
Based on my calculation of aggregate metrics reported in the next table, portfolio quality is significantly superior to the benchmark. The return on assets is especially good.
|
XMHQ |
MDY |
|
|
Altman Z-score |
7.63 |
3.09 |
|
Piotroski F-score |
6.49 |
5.63 |
|
ROA % TTM |
13.99 |
5.07 |
Competitors
The next table compares characteristics of XMHQ and three mid-cap ETFs with a tilt to quality.
- John Hancock Multifactor Mid Cap ETF (JHMM)
- First Trust Mid Cap Core AlphaDEX Fund (FNX)
- ProShares S&P MidCap 400 Div Aristocrats ETF (REGL).
|
XMHQ |
JHMM |
FNX |
REGL |
|
|
Inception |
12/1/2006 |
9/28/2015 |
5/8/2007 |
2/3/2015 |
|
Expense Ratio |
0.33% |
0.42% |
0.60% |
0.40% |
|
AUM |
$2.55B |
$3.59B |
$1.12B |
$1.56B |
|
Avg Daily Volume |
$22.22M |
$14.56M |
$3.34M |
$6.05M |
XMHQ has the lowest fee and is the most liquid in dollar volume.
The next chart compares total returns starting on 10/5/2015 to match all inception dates. XMHQ is ahead of its competitors, with most, if not all, of outperformance happening in the last 12 months.
XMHQ vs competitors since 10/5/2015 (Seeking Alpha)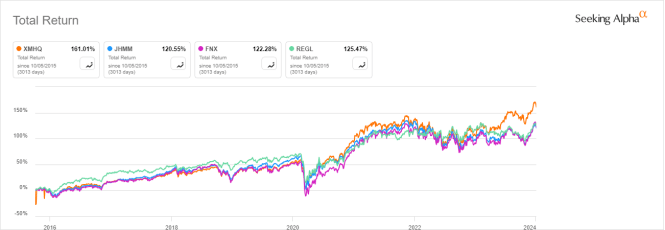
XMHQ vs competitors, trailing 12 months (Seeking Alpha)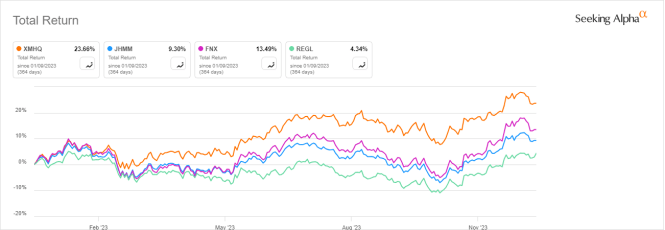
Takeaway
Invesco S&P MidCap Quality ETF is invested in 79 mid-cap companies with a good quality score based on ROE, accruals and financial leverage. It is well-diversified across holdings, but overweight in industrials. XMHQ has outperformed the benchmark and competitors in the last 12 months. However, performance was average before 2023. Since its inception in December 2006, the Invesco S&P MidCap Quality ETF fund has not brought significant excess return over the mid-cap benchmark, and it shows similar risk metrics. XMHQ is not riskier than other mid-cap funds, but recent outperformance may not represent its long-term potential.

 Q2 2024 Earnings Call Transcript")

